Fig. 11.
Download original image
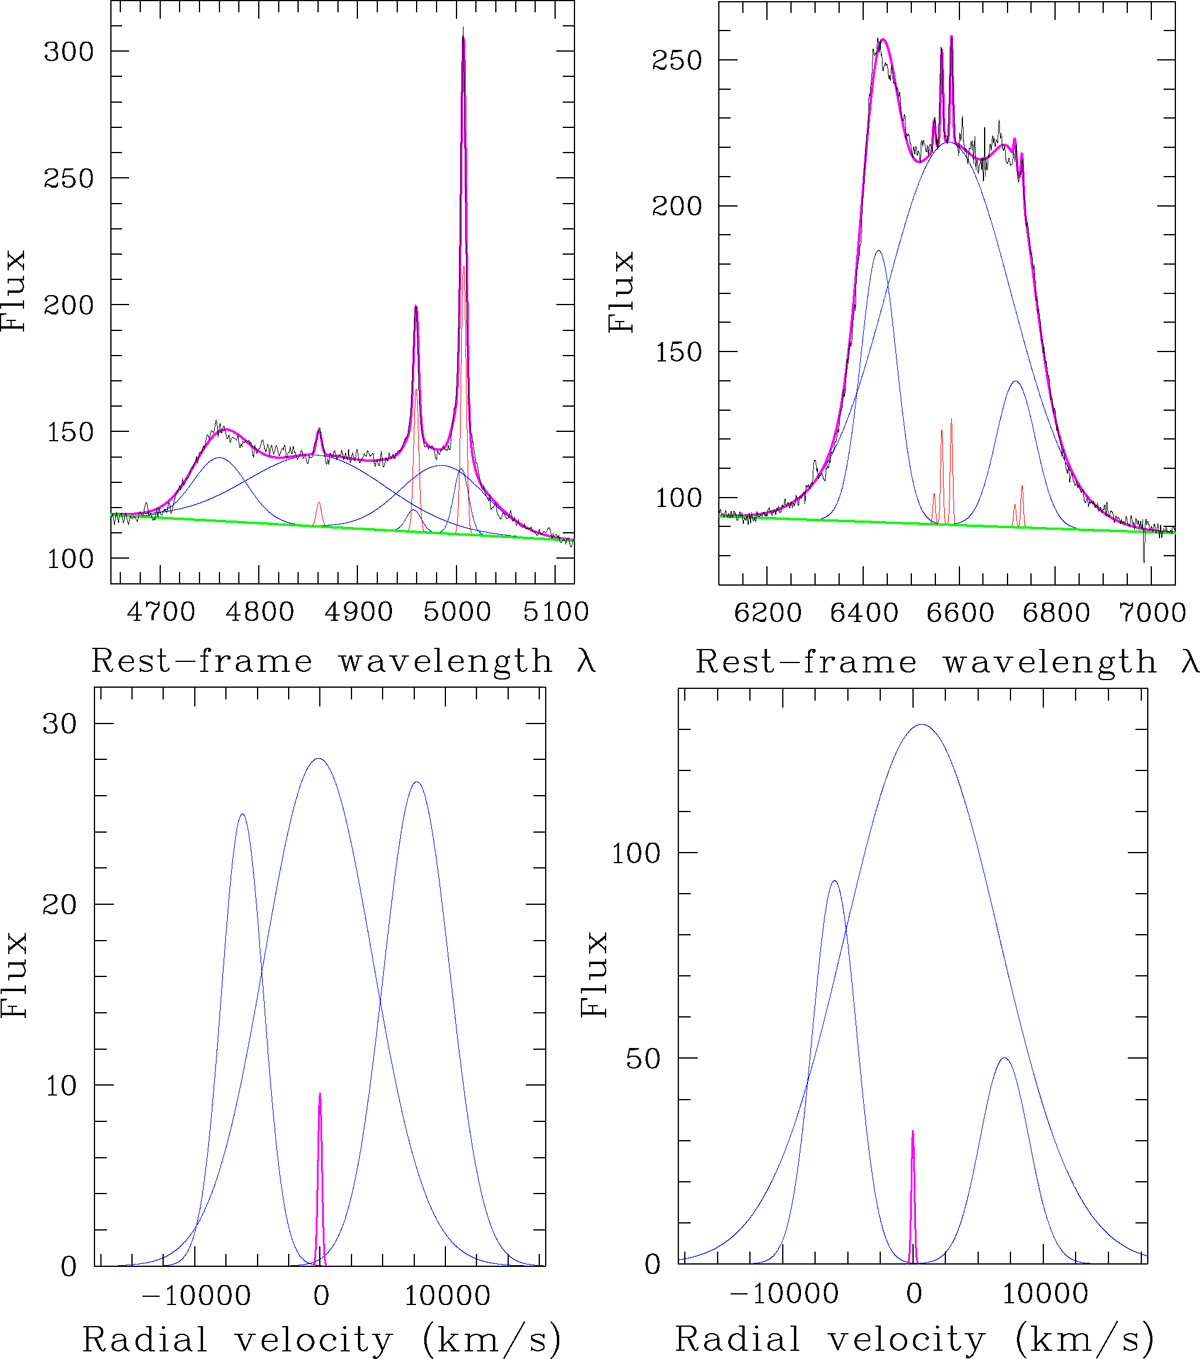
Top: Best model fit of the regions around Hβ (left) and Hα (right) of SDSS J161742.53+322234.4. The fit of the Hβ-[O III] complex includes eight Gaussian emission components: Three narrow lines (red), three broad Hβ lines (blue), and two broad [O III] lines (blue). Eight Gaussian components were also included for the Hα-[N II]-[S II] complex: Five narrow lines (red) and three broad Hα lines (blue). A first-order polynomial for the continuum is shown in green, the resulting composed model spectra in magenta, and the observed spectrum in black. Bottom: Line profiles for the Hβ (left) and the Hα (right) complexes converted into relative velocities.
Current usage metrics show cumulative count of Article Views (full-text article views including HTML views, PDF and ePub downloads, according to the available data) and Abstracts Views on Vision4Press platform.
Data correspond to usage on the plateform after 2015. The current usage metrics is available 48-96 hours after online publication and is updated daily on week days.
Initial download of the metrics may take a while.