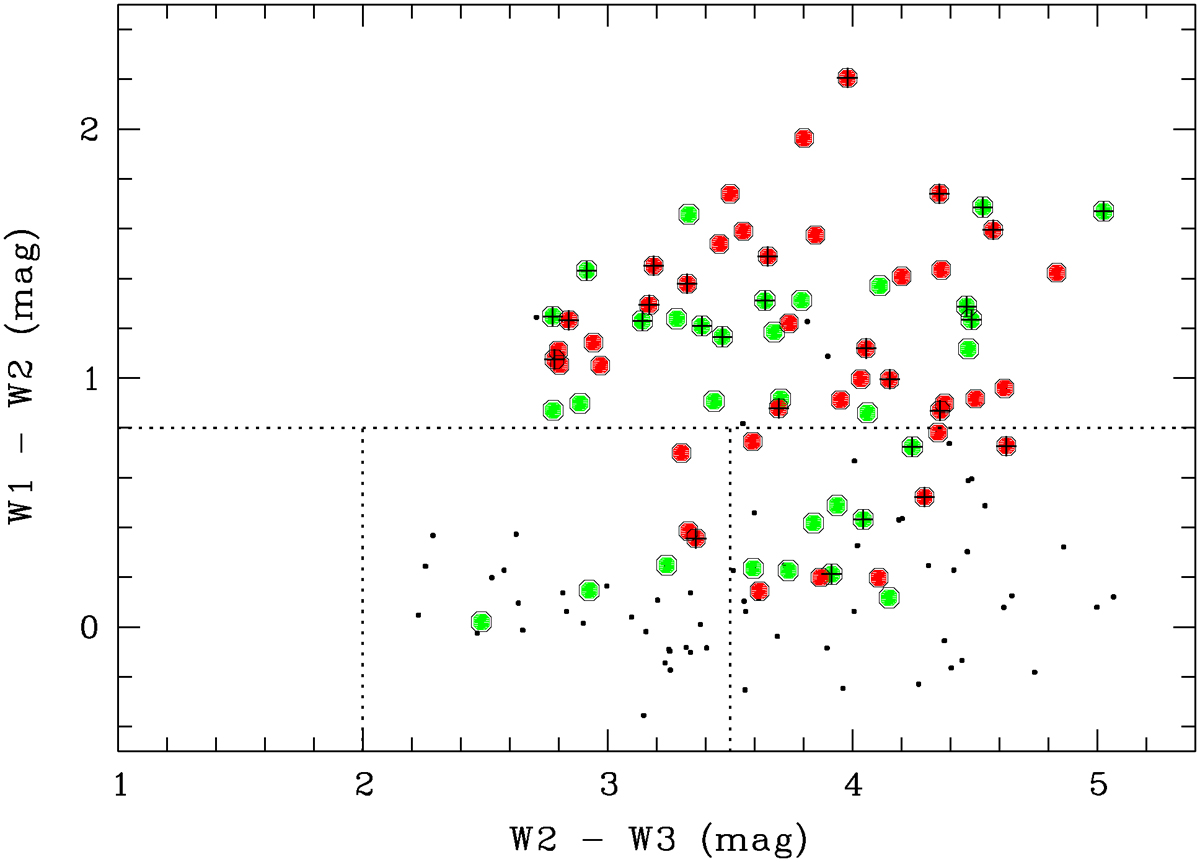
Fig. 13.
Download original image
As in Fig. 6, but only for the 152 galaxies with z ≥ 0.6, rz ≥ 2, and available magnitudes in the first three WISE bands. Sources with uncertainties < 0.5 mag for W3 and < 0.2 mag for W1 and W2 are plotted as filled coloured circles (z < 0.8 green, z ≥ 0.8 red), all others as black dots. Radio-loud galaxies are marked by a black plus sign.
Current usage metrics show cumulative count of Article Views (full-text article views including HTML views, PDF and ePub downloads, according to the available data) and Abstracts Views on Vision4Press platform.
Data correspond to usage on the plateform after 2015. The current usage metrics is available 48-96 hours after online publication and is updated daily on week days.
Initial download of the metrics may take a while.