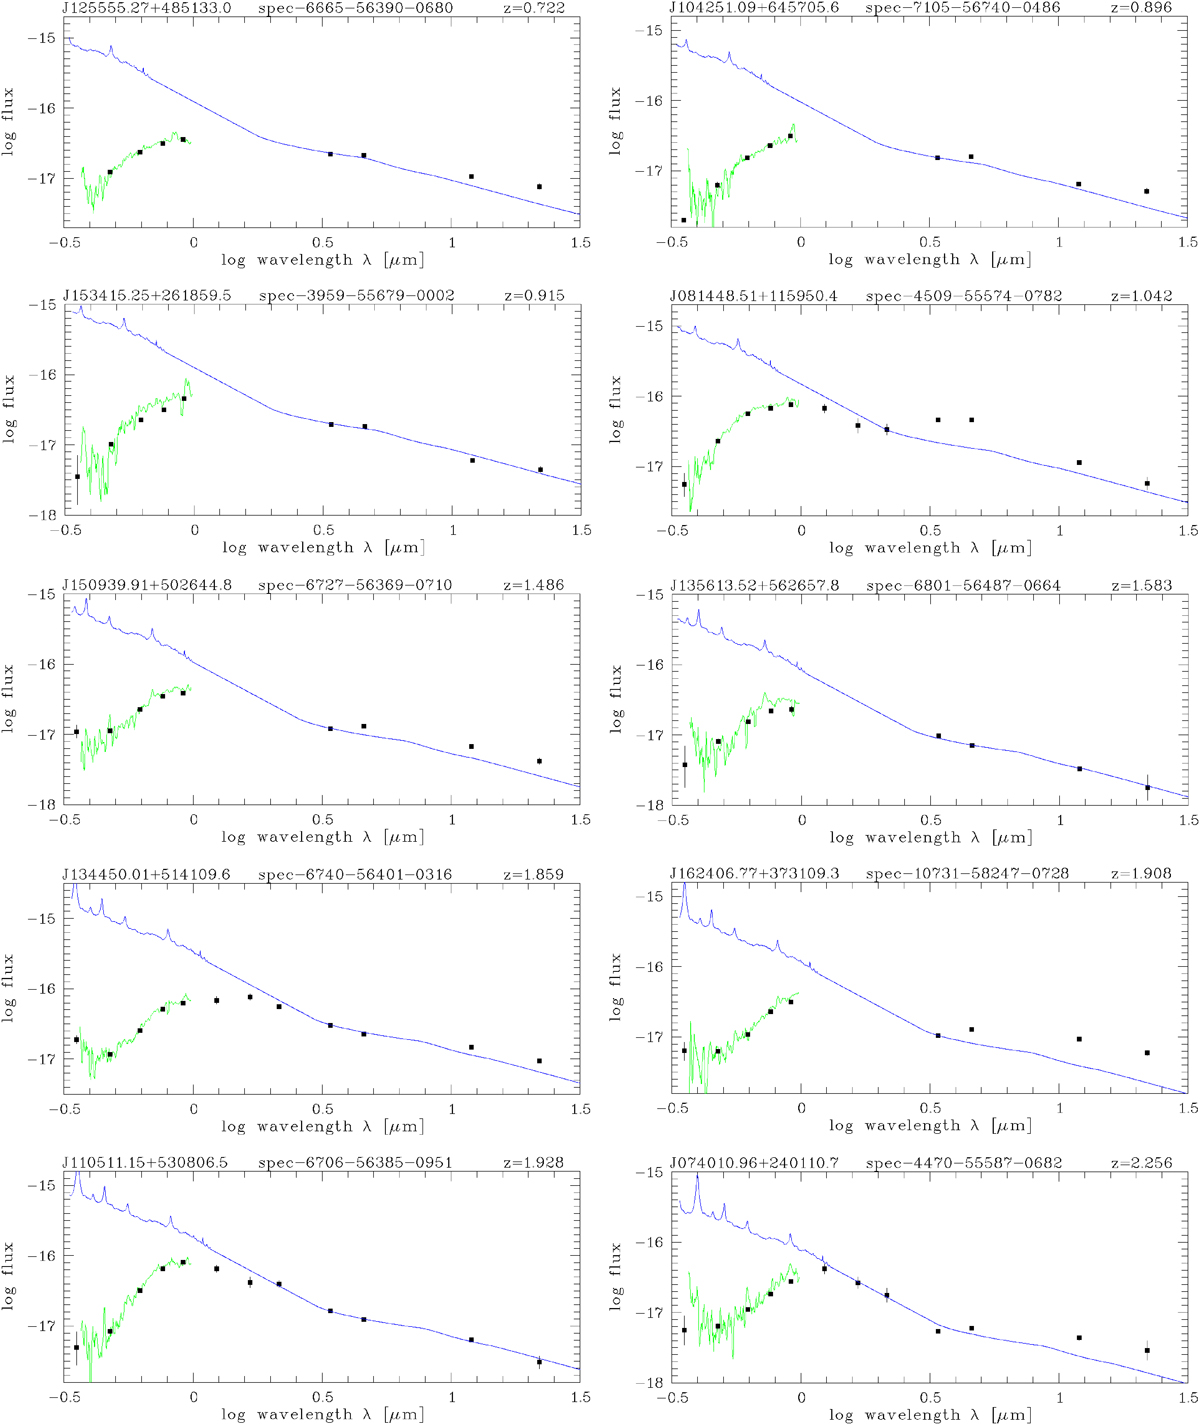
Fig. B.1.
Download original image
MBSEDs (in the observer’s frame) for the ten QSOs with the highest colour excess E(g − z). The flux is in units of erg s−1 cm−2 Å−1. The black squares with error bars are the fluxes from photometric data; the SDSS spectra are plotted in green (both corrected for Galactic foreground extinction). The template spectrum for bright QSOs of type 1 from Polletta et al. (2007) is shown in blue.
Current usage metrics show cumulative count of Article Views (full-text article views including HTML views, PDF and ePub downloads, according to the available data) and Abstracts Views on Vision4Press platform.
Data correspond to usage on the plateform after 2015. The current usage metrics is available 48-96 hours after online publication and is updated daily on week days.
Initial download of the metrics may take a while.