Fig. B.2.
Download original image
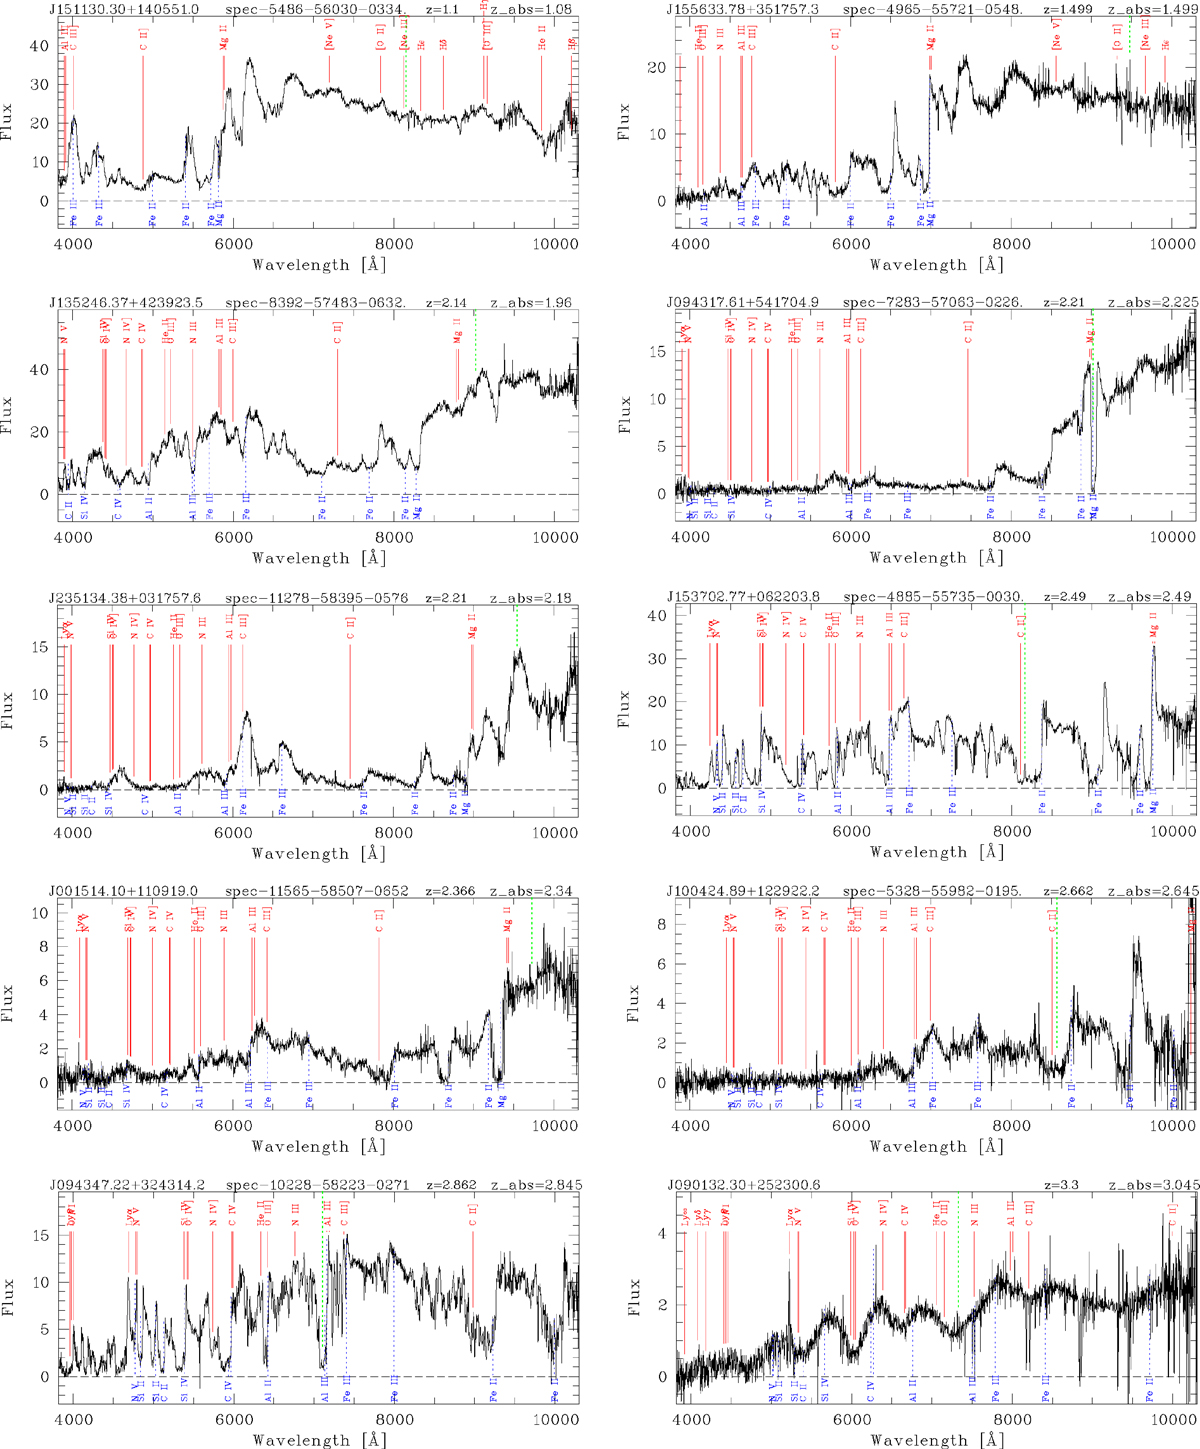
Examples of FeLoBAL QSOs. The red solid vertical lines indicate the positions of the emission lines that are typical for QSO spectra; the blue dotted lines mark the positions of typical absorption lines. The best estimates for the emission line redshift z and the absorption line redshift zabs are given at the top of each panel. The vertical green dotted line marks the position of the Ly α line for the redshift given by the SDSS DR16. The flux is in units of 10−17 erg s−1 cm−2 Å−1. The spectrum of SDSS J090132.30+252400.6 (bottom right) is the result of the coaddition of three SDSS spectra.
Current usage metrics show cumulative count of Article Views (full-text article views including HTML views, PDF and ePub downloads, according to the available data) and Abstracts Views on Vision4Press platform.
Data correspond to usage on the plateform after 2015. The current usage metrics is available 48-96 hours after online publication and is updated daily on week days.
Initial download of the metrics may take a while.