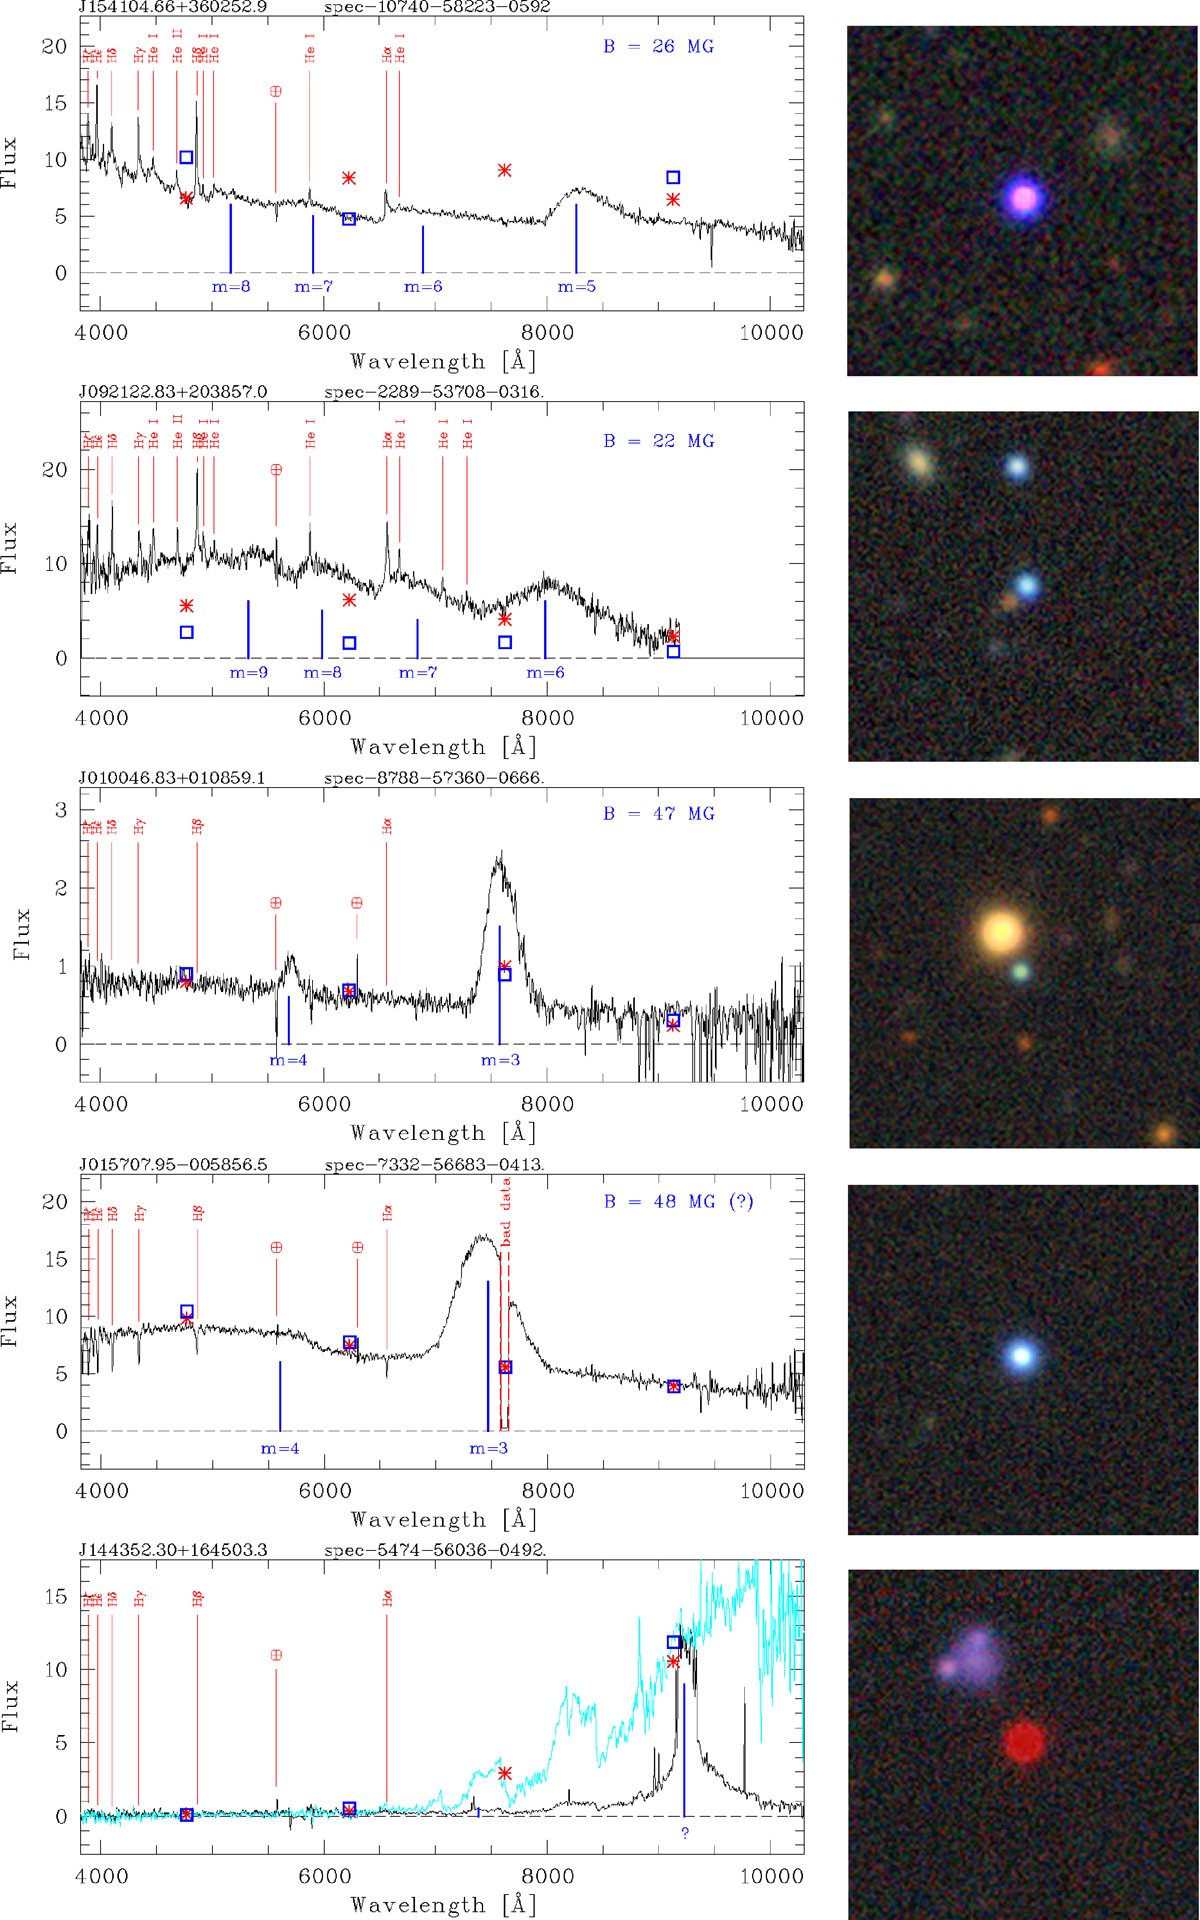
Fig. B.7.
Download original image
Spectra with real or false emission humps that seem to indicate cyclotron radiation from polars. The flux is Fλ in units of 10−17 erg s−1 cm−2 Å−1. The best matches for the cyclotron harmonics m are marked by blue vertical lines. The estimated magnetic flux density B is given in the top right corner. The positions of the Balmer lines and of identified He lines are displayed by red vertical lines; the ⊕ symbols indicate telluric lines. The red asterisks mark the flux densities derived from the SDSS magnitudes and the open blue squares are the flux densities corresponding to the LS magnitudes in the griz bands. In the bottom panel (SDSS J144352.30+164503.3), the black spectrum is from DR16, whereas the cyan spectrum is the same spectrum from DR15 (i.e. an earlier version of the pipeline). The RGB images on the right are cutouts from the LS and have side lengths of 20 arcsec. The object in the image centre is the source of the spectrum.
Current usage metrics show cumulative count of Article Views (full-text article views including HTML views, PDF and ePub downloads, according to the available data) and Abstracts Views on Vision4Press platform.
Data correspond to usage on the plateform after 2015. The current usage metrics is available 48-96 hours after online publication and is updated daily on week days.
Initial download of the metrics may take a while.