Fig. 4.
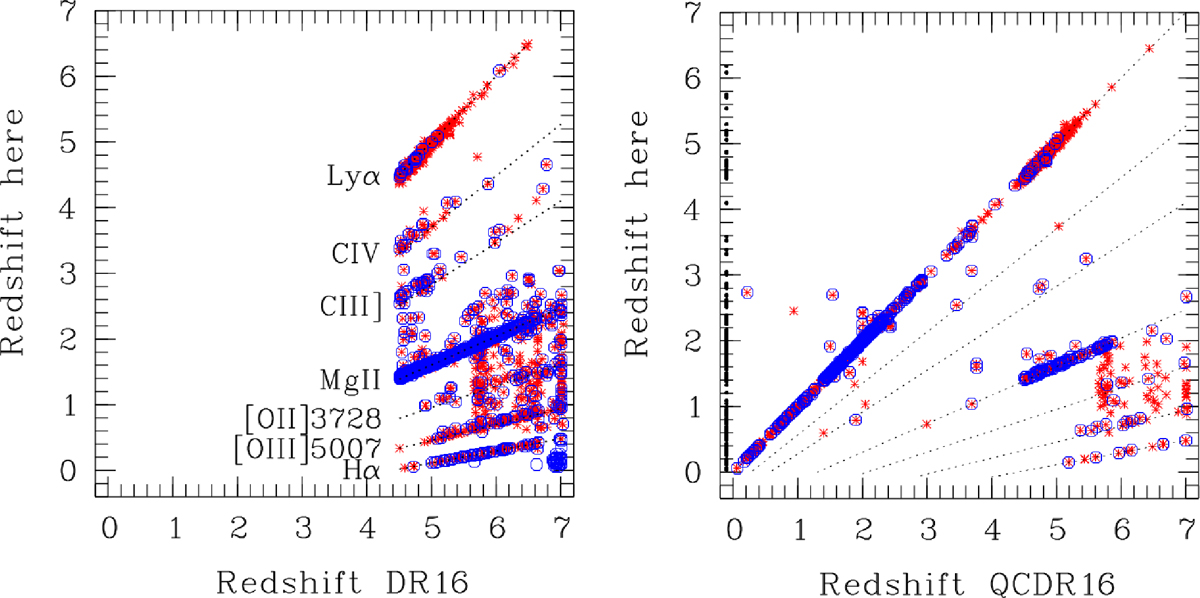
Download original image
Revised redshift from the present work vs redshift from the SDSS DR16 pipeline (left) and vs redshift from the QCDR16 (Lyke et al. 2020) (right) for the QSOs with rz ≥ 2. QSOs with unusual spectra (Sect. 3.5) are marked by blue circles. Black dotted lines: Relations that result when one of the labelled emission lines was interpreted as Lyα in the comparison sample. The dots at z(QCDR16) < 0 indicate sources that are not included in the QCDR16.
Current usage metrics show cumulative count of Article Views (full-text article views including HTML views, PDF and ePub downloads, according to the available data) and Abstracts Views on Vision4Press platform.
Data correspond to usage on the plateform after 2015. The current usage metrics is available 48-96 hours after online publication and is updated daily on week days.
Initial download of the metrics may take a while.