Fig. 1
Download original image
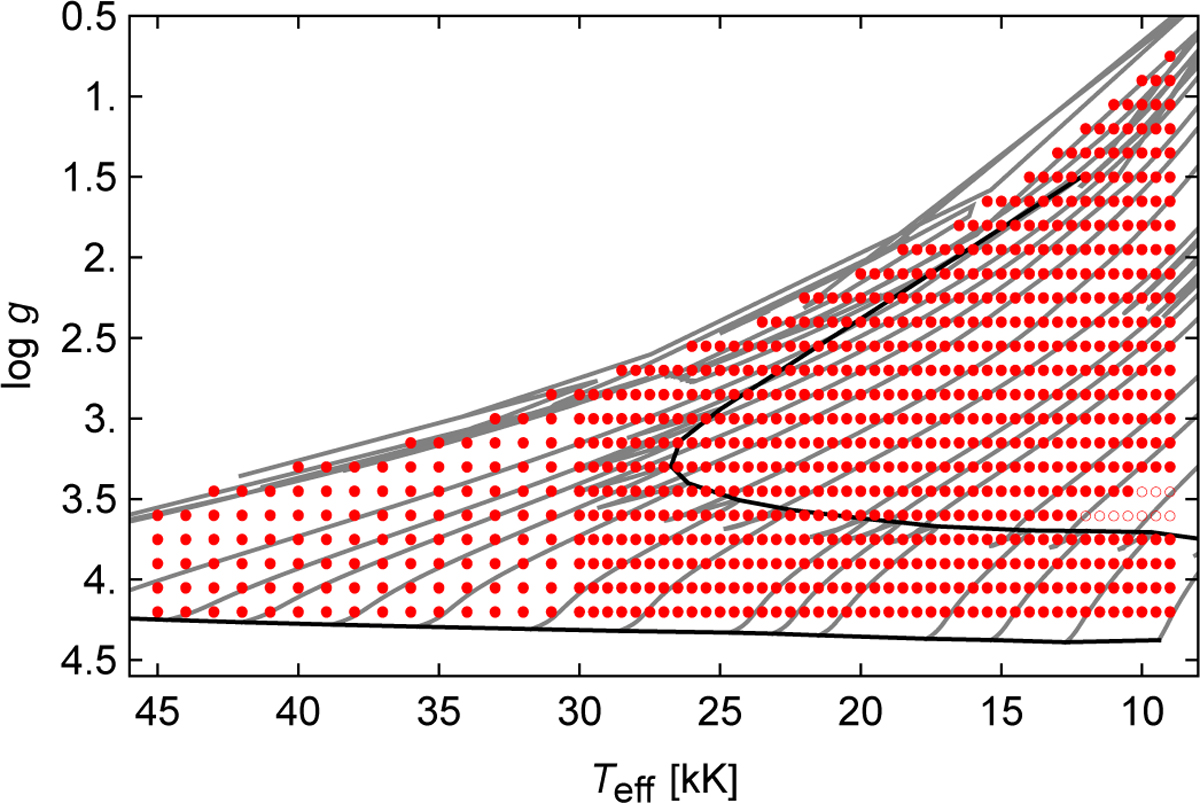
Location of ISOSCELES models in Teff–log g plane (red dots). Grey solid lines represent the evolutionary tracks from 2 M⊙ to 60 M⊙ without rotation (Ekström et al. 2012). Solid black lines correspond to both zero-age main sequence (ZAMS) and terminal-age main sequence (TAMS). Red (empty) circles indicate non-converged models in ISOSCELES.
Current usage metrics show cumulative count of Article Views (full-text article views including HTML views, PDF and ePub downloads, according to the available data) and Abstracts Views on Vision4Press platform.
Data correspond to usage on the plateform after 2015. The current usage metrics is available 48-96 hours after online publication and is updated daily on week days.
Initial download of the metrics may take a while.