Fig. 6
Download original image
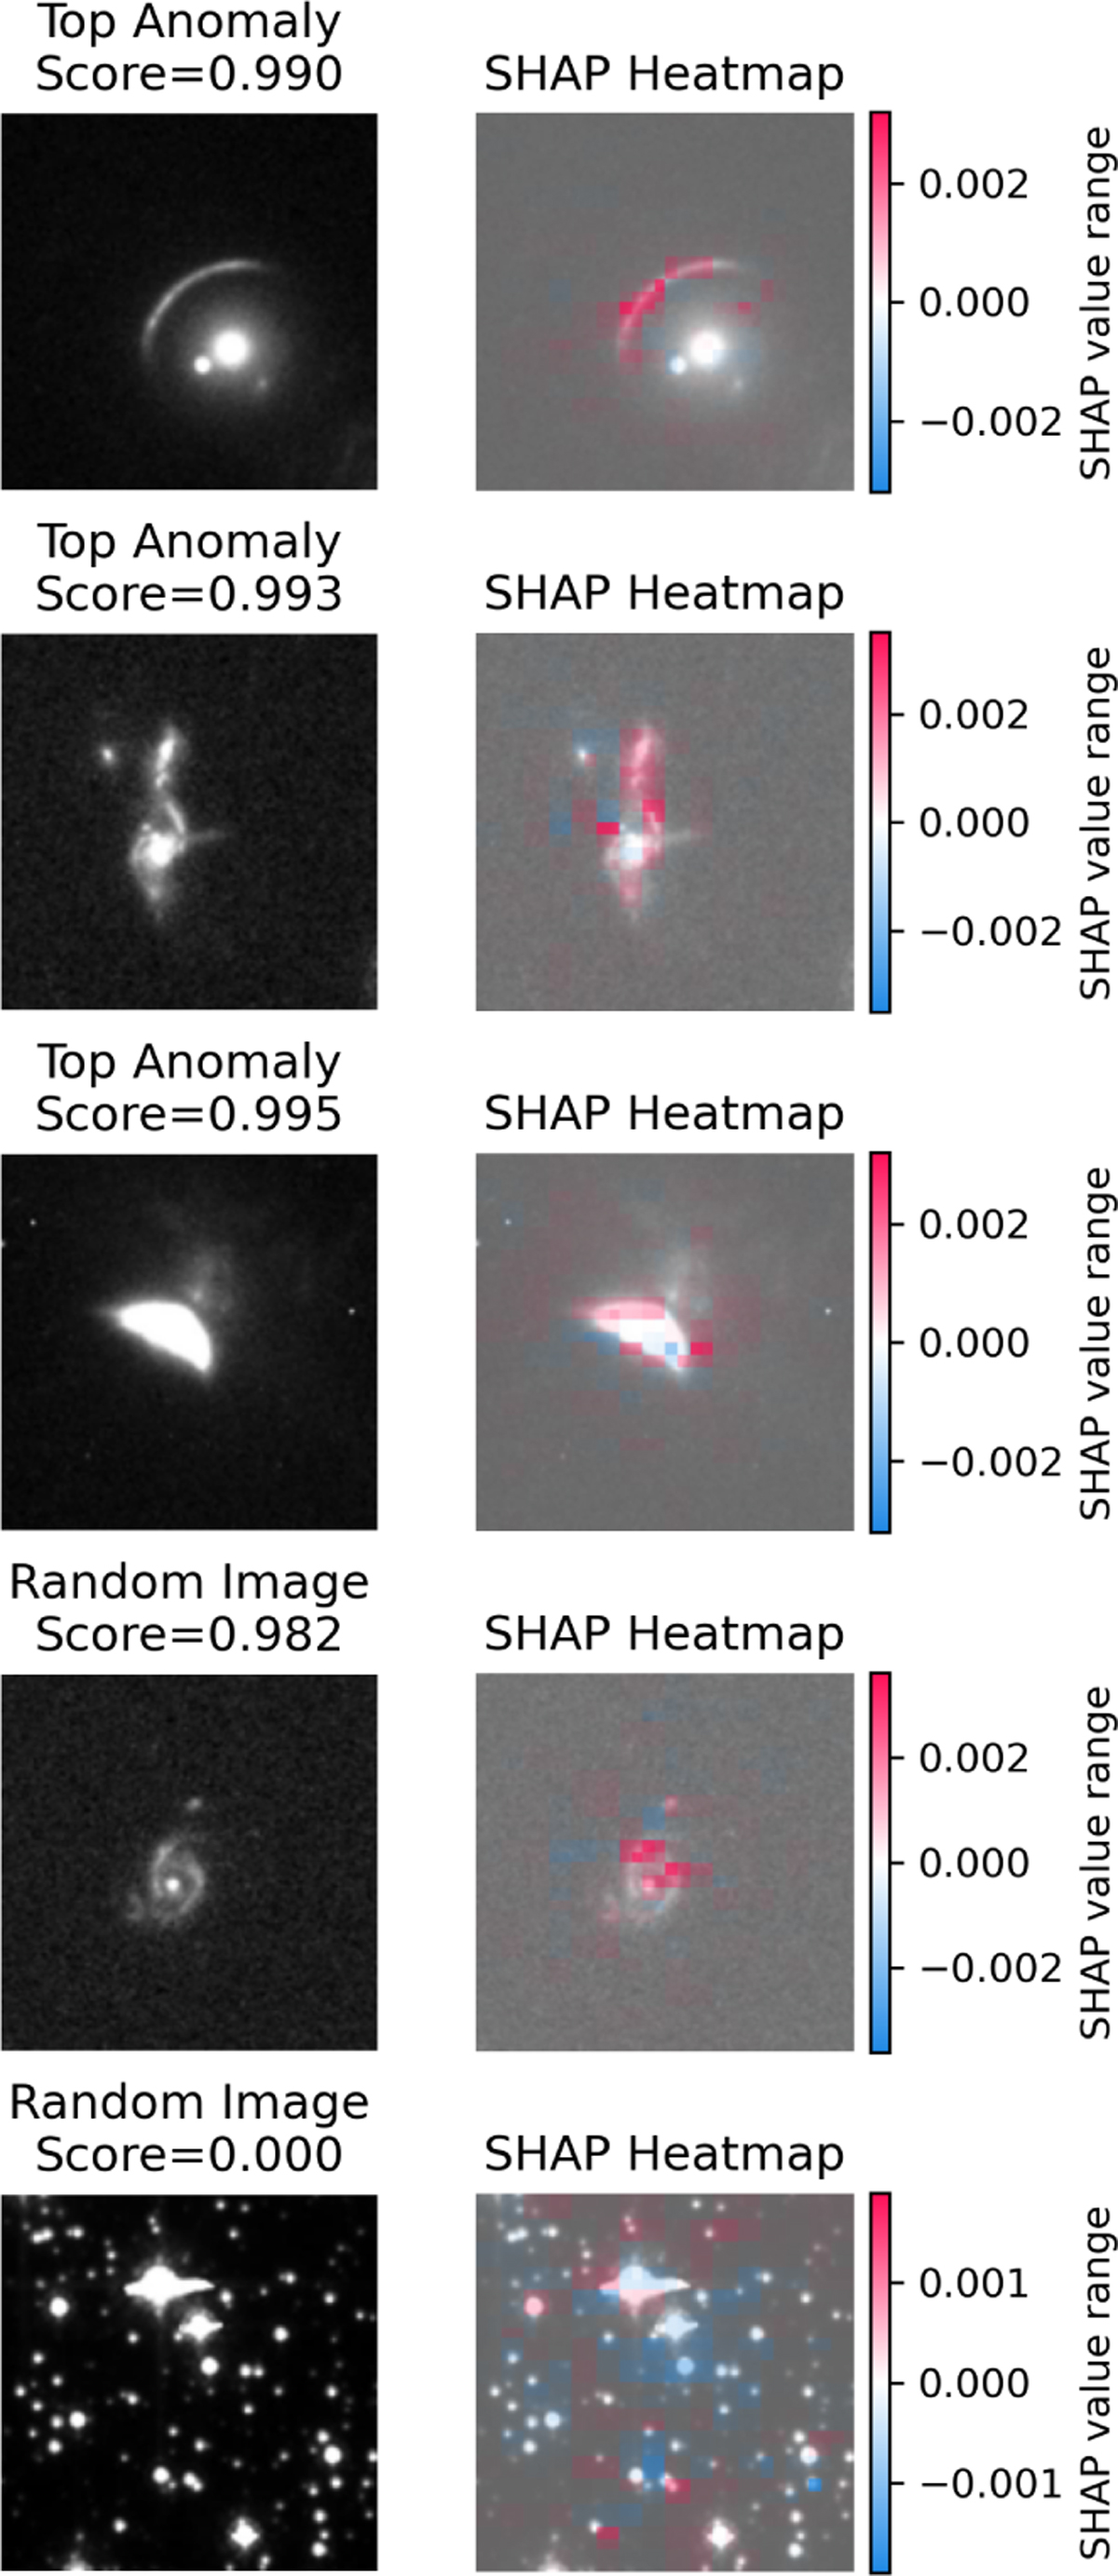
Saliency plots for three highly scored anomalies, one high scoring false positive, and one low-scoring image, presented as heat maps of the SHAP values assigned to each pixel. These visualisations highlight the regions most relevant to the models predictions, often corresponding to features a human might also consider significant (or lack thereof, in the case of the final image).
Current usage metrics show cumulative count of Article Views (full-text article views including HTML views, PDF and ePub downloads, according to the available data) and Abstracts Views on Vision4Press platform.
Data correspond to usage on the plateform after 2015. The current usage metrics is available 48-96 hours after online publication and is updated daily on week days.
Initial download of the metrics may take a while.