Open Access
Fig. 4
Download original image
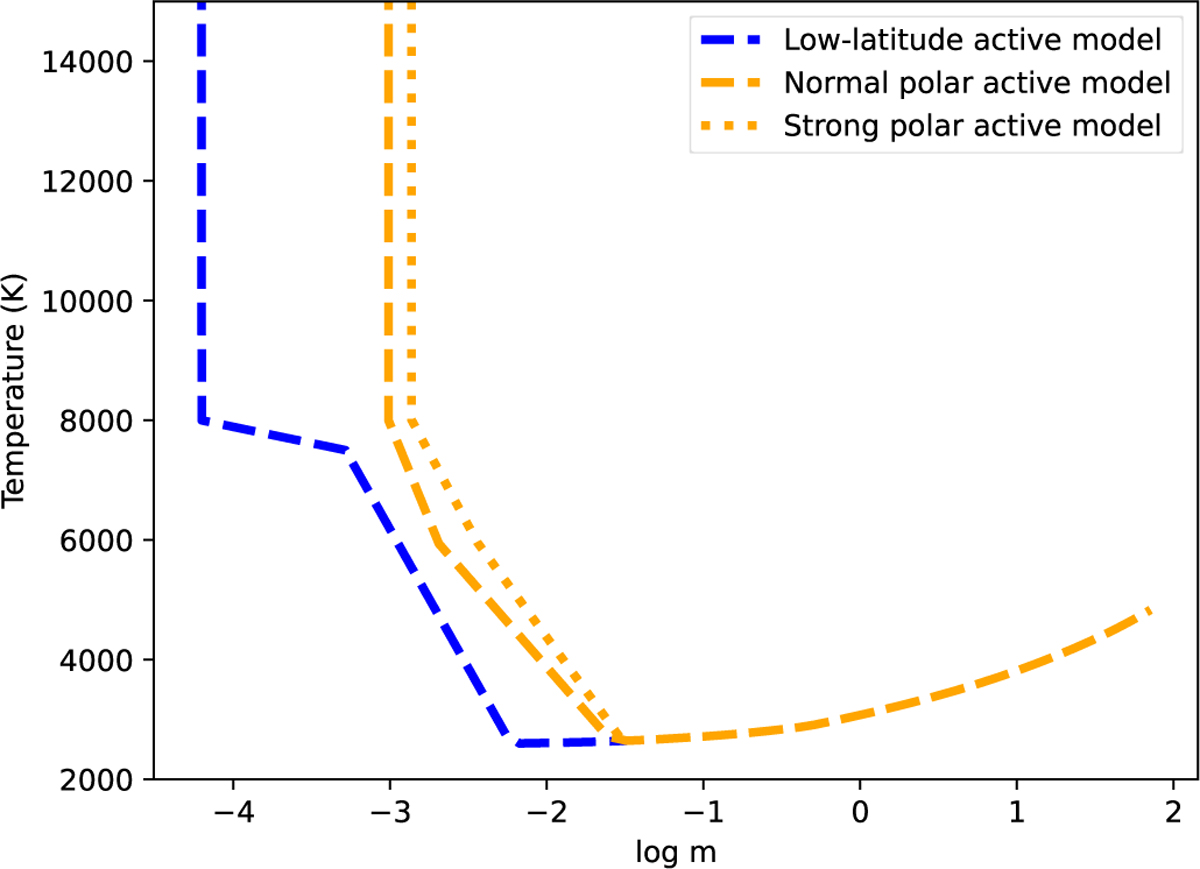
Temperature stratification across chromospheric models: the plot illustrates how temperature varies with column mass (log m) for the low-latitude active model (dashed blue line) and for the polar models in both their normal (dashed orange) and enhanced (dotted orange) states.
Current usage metrics show cumulative count of Article Views (full-text article views including HTML views, PDF and ePub downloads, according to the available data) and Abstracts Views on Vision4Press platform.
Data correspond to usage on the plateform after 2015. The current usage metrics is available 48-96 hours after online publication and is updated daily on week days.
Initial download of the metrics may take a while.