Fig. 6
Download original image
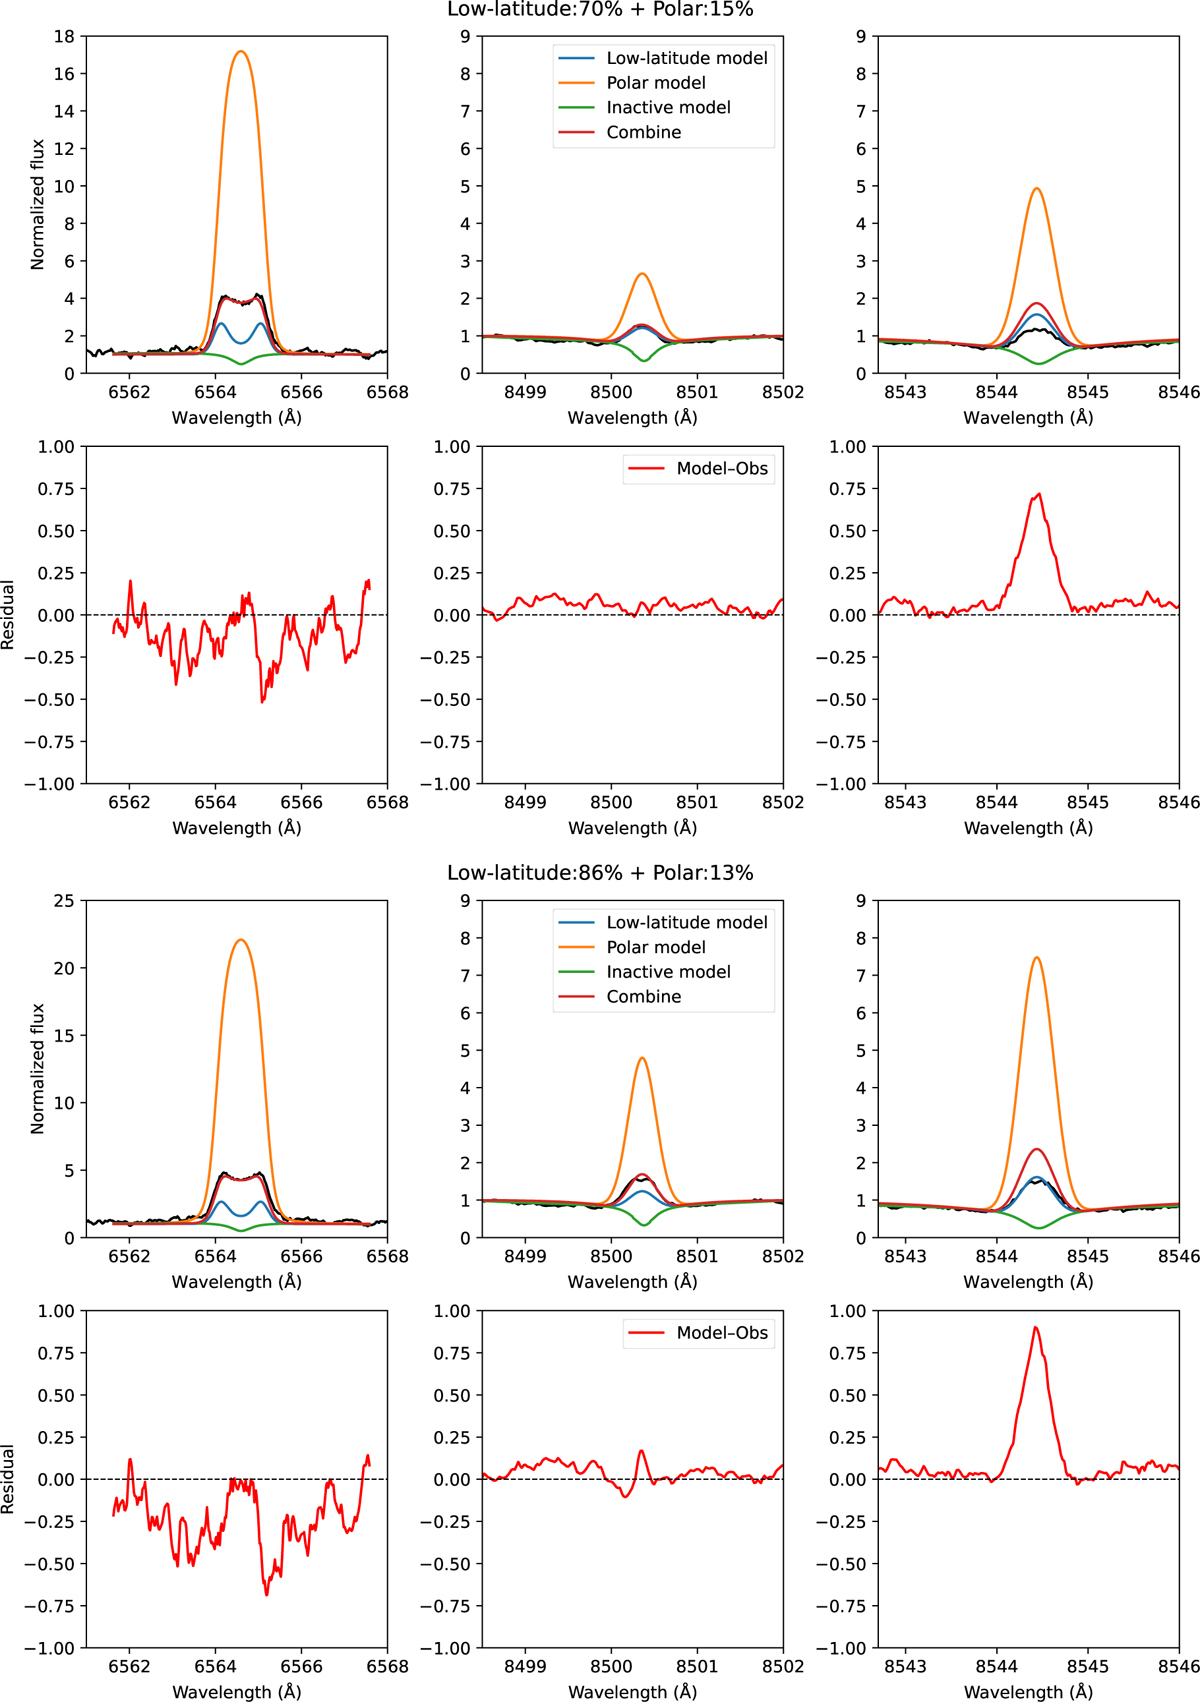
Comparison of AD Leo spectra with our multi-component model: the top two rows correspond to a representative observation fitted with nominal polar and low-latitude active regions plus the inactive component, while the bottom two rows use an enhanced polar active region to match the four high-flux epochs. Observed data are in black; individual model contributions from the low-latitude and polar active regions are shown in blue and orange, respectively; the quiet-region template in green; and the composite fit in red, demonstrating accurate reproduction of both line cores and wings. he second and fourth rows in each column show the residuals (model minus observation) in red, highlighting the small deviations between model and data.
Current usage metrics show cumulative count of Article Views (full-text article views including HTML views, PDF and ePub downloads, according to the available data) and Abstracts Views on Vision4Press platform.
Data correspond to usage on the plateform after 2015. The current usage metrics is available 48-96 hours after online publication and is updated daily on week days.
Initial download of the metrics may take a while.