Fig. 2.
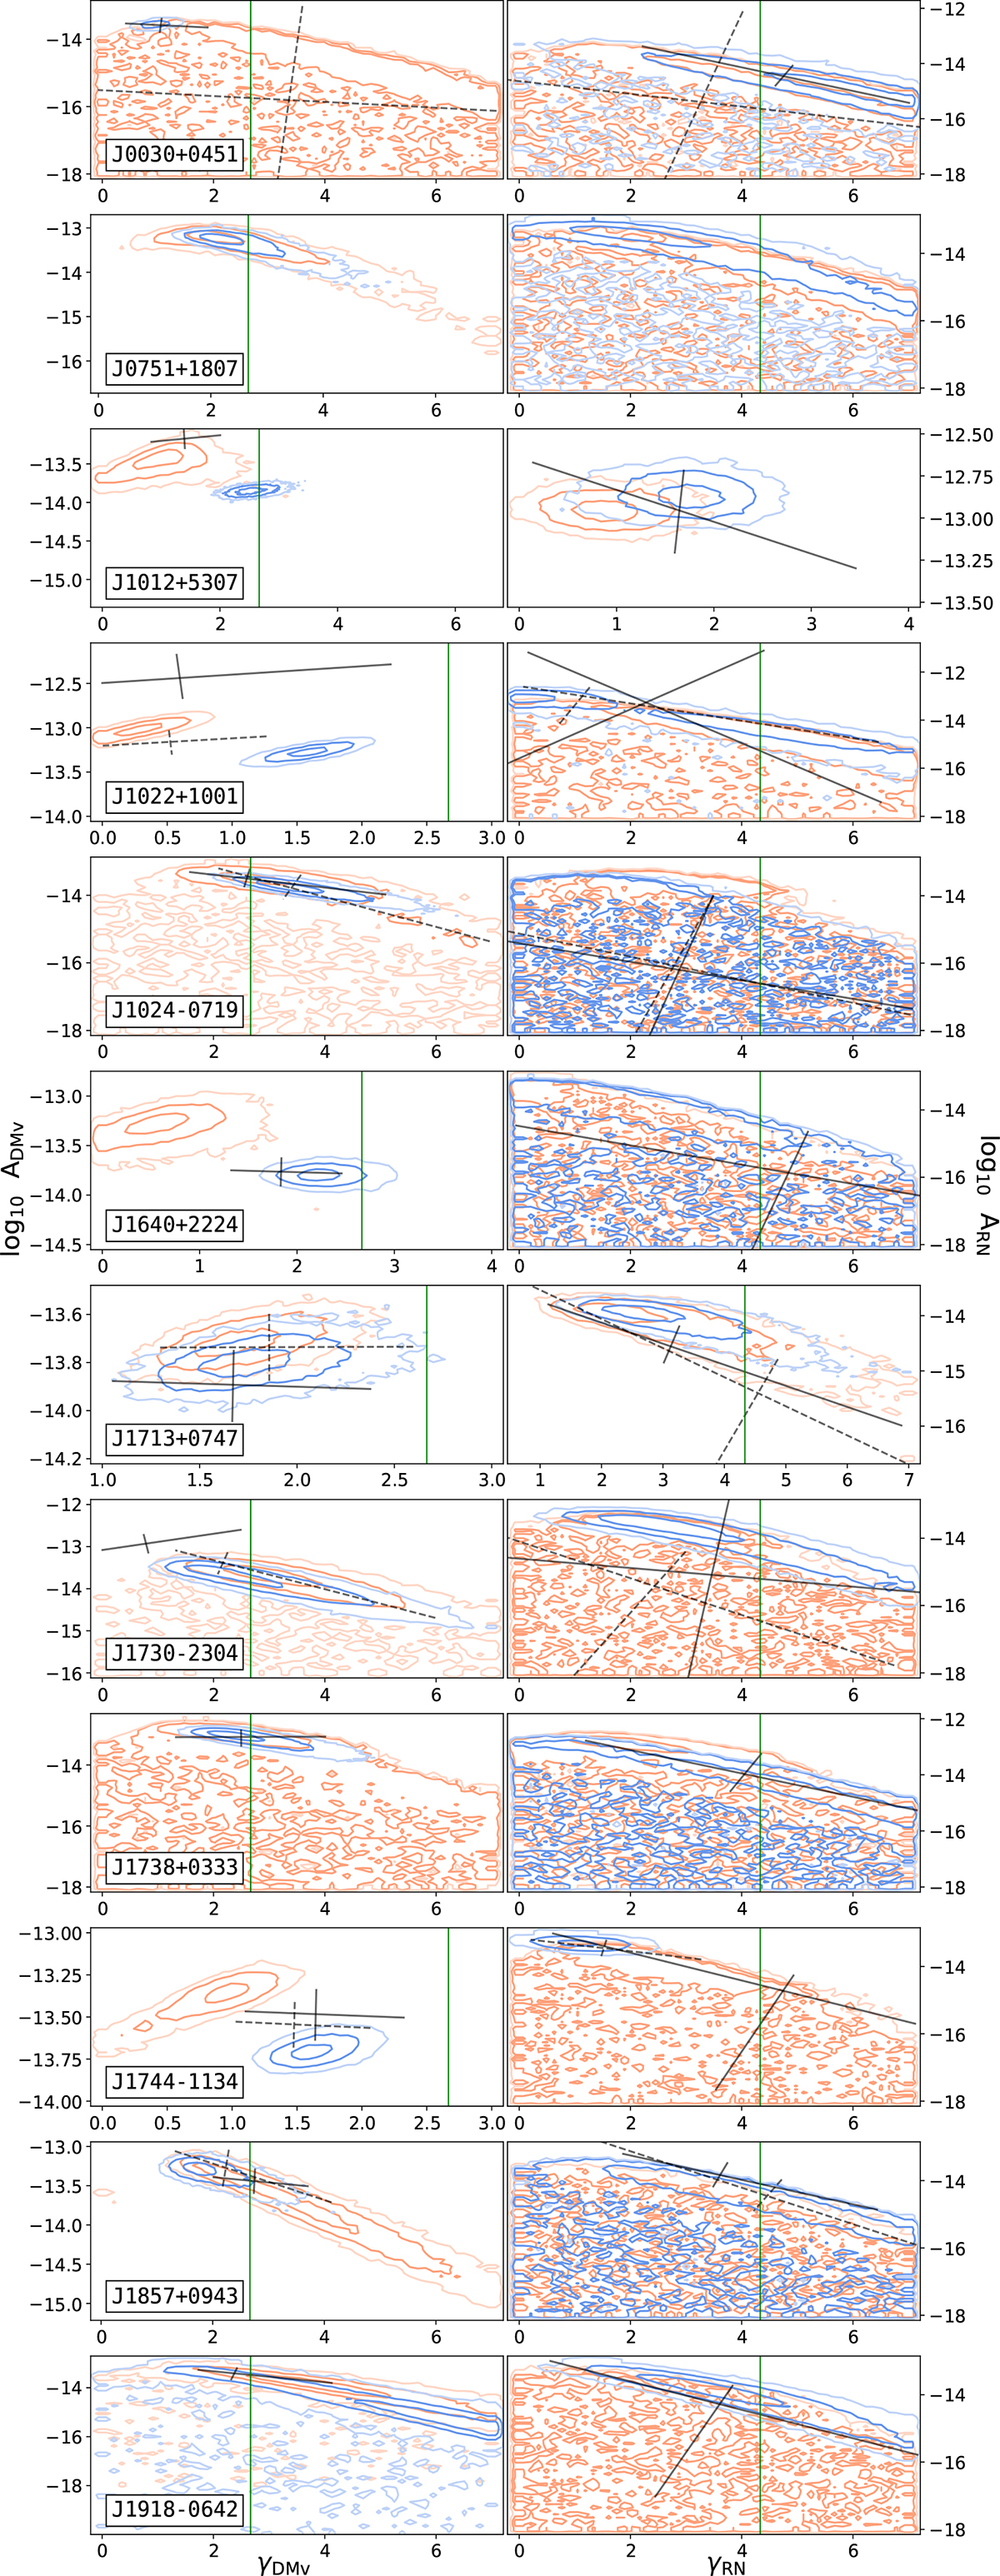
Download original image
Spectral index vs. amplitude posterior distributions of the power-law PSD for DMv (left) and RN (right) obtained for 12 pulsars from DR2low (blue) and DR2new+ (orange) using the standard noise models. The green vertical lines show the predicted spectral index from a Kolmogorov turbulence in the IISM for DMv (left), and from circular and GW-driven SMBHBs (right). The black crosses display the 99.7% credible intervals of posterior distributions obtained with NANOGrav-15yr and PPTA DR3, displaying the principal directions.
Current usage metrics show cumulative count of Article Views (full-text article views including HTML views, PDF and ePub downloads, according to the available data) and Abstracts Views on Vision4Press platform.
Data correspond to usage on the plateform after 2015. The current usage metrics is available 48-96 hours after online publication and is updated daily on week days.
Initial download of the metrics may take a while.