Fig. 5.
Download original image
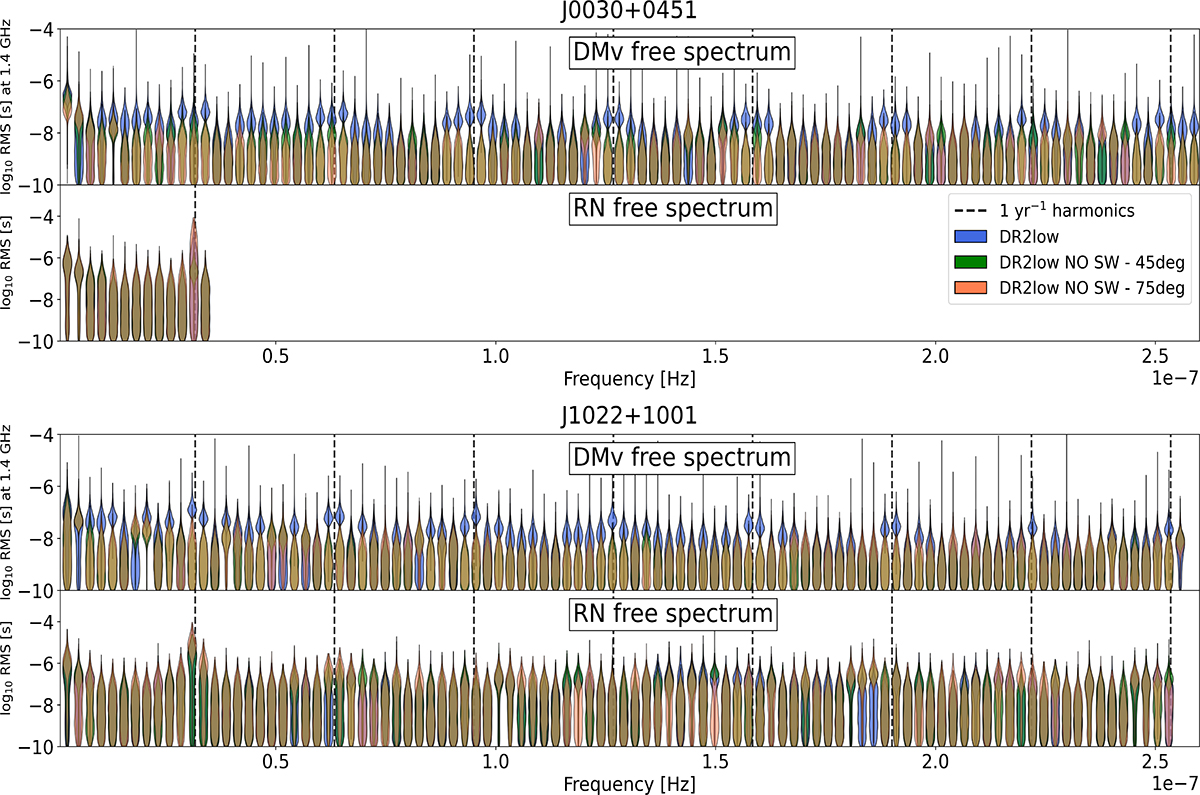
Free spectra for DMv (referred to 1.4GHz) and RN for PSR J0030+0451 (top) and PSR J1022+1001 (bottom). Each violin represents the posterior distribution of the RMS amplitude in a given Fourier bin. The blue violins correspond to the full DR2low dataset; the green and orange violins show the results obtained after applying solar angle cuts of 45° and 75°, respectively. The vertical dashed lines indicate the harmonics of the 1yr−1 frequency, which is representative of the SW effect. The number of Fourier bins displayed matches that of the preferred noise model listed in Table 1.
Current usage metrics show cumulative count of Article Views (full-text article views including HTML views, PDF and ePub downloads, according to the available data) and Abstracts Views on Vision4Press platform.
Data correspond to usage on the plateform after 2015. The current usage metrics is available 48-96 hours after online publication and is updated daily on week days.
Initial download of the metrics may take a while.