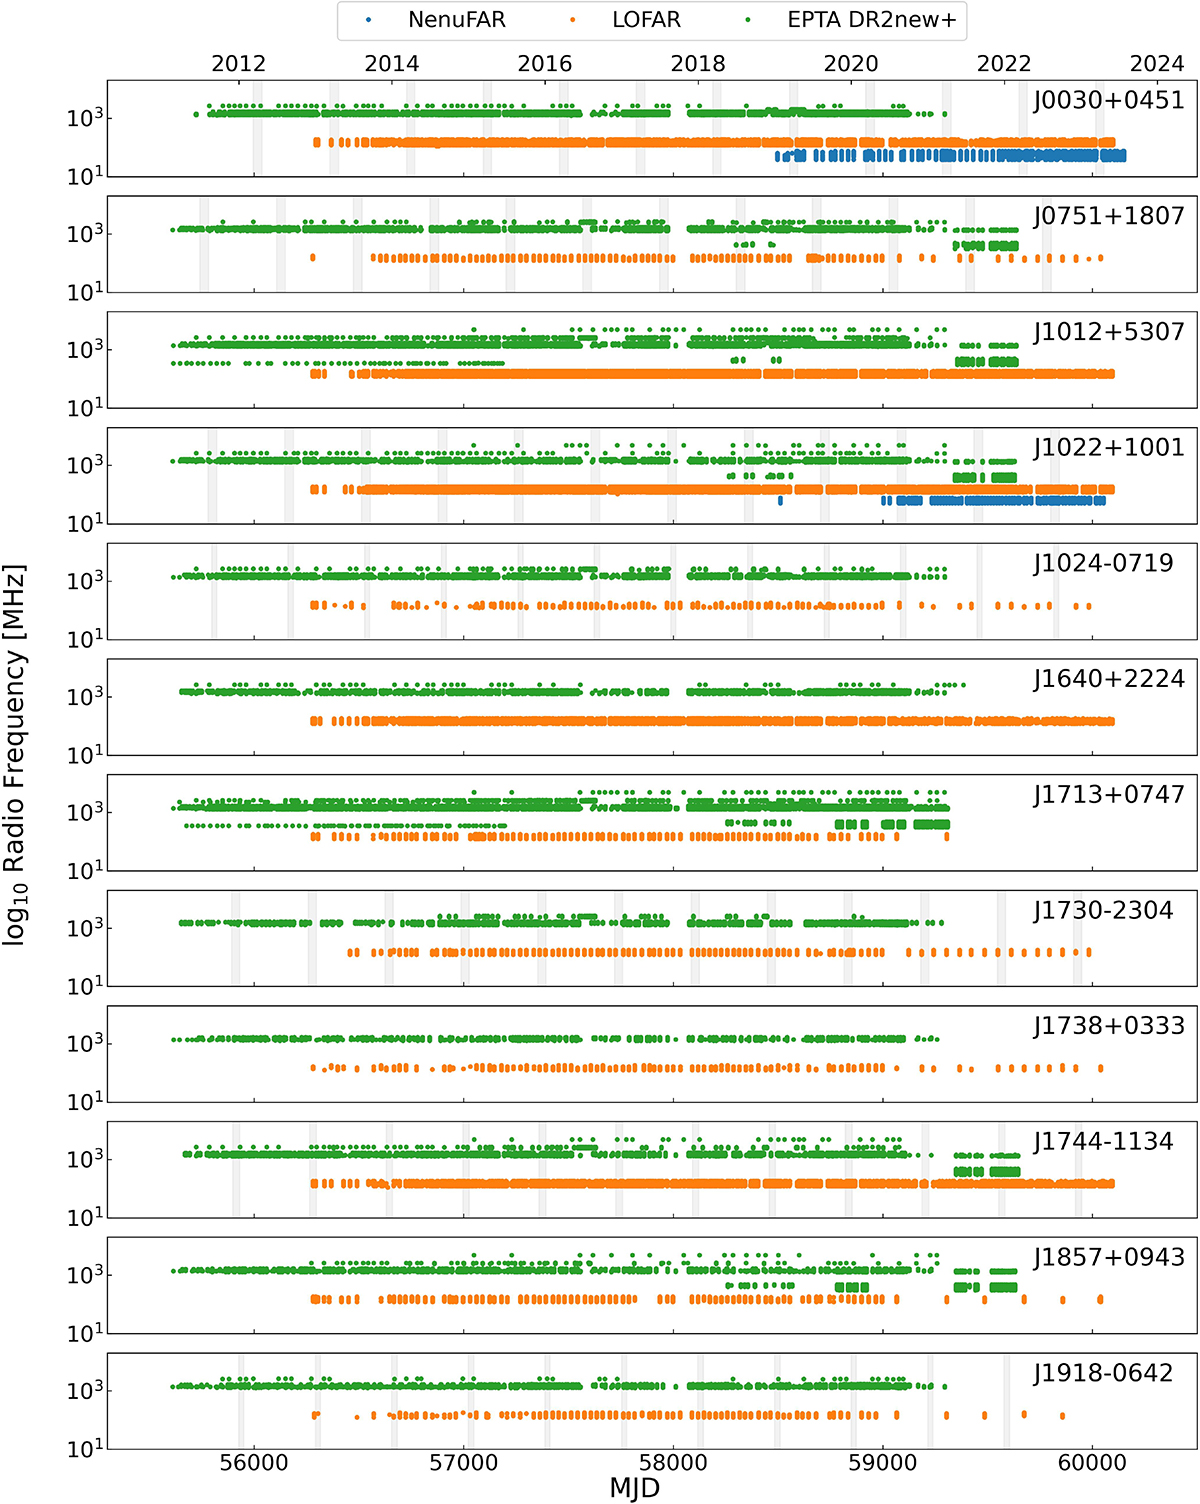
Fig. D.1.
Download original image
Time in year and MJD (resp. for the top and bottom x-axes) vs. observing frequency (in MHz) shown in logarithmic scale for the 12 pulsars considered in this work displayed in green, orange, and blue respectively for the DR2new+, LOFAR, and NenuFAR data. The gray vertical areas emphasize the periods when the pulsar-sun angles are equal to or lower than 20 degrees.
Current usage metrics show cumulative count of Article Views (full-text article views including HTML views, PDF and ePub downloads, according to the available data) and Abstracts Views on Vision4Press platform.
Data correspond to usage on the plateform after 2015. The current usage metrics is available 48-96 hours after online publication and is updated daily on week days.
Initial download of the metrics may take a while.