Fig. 5
Download original image
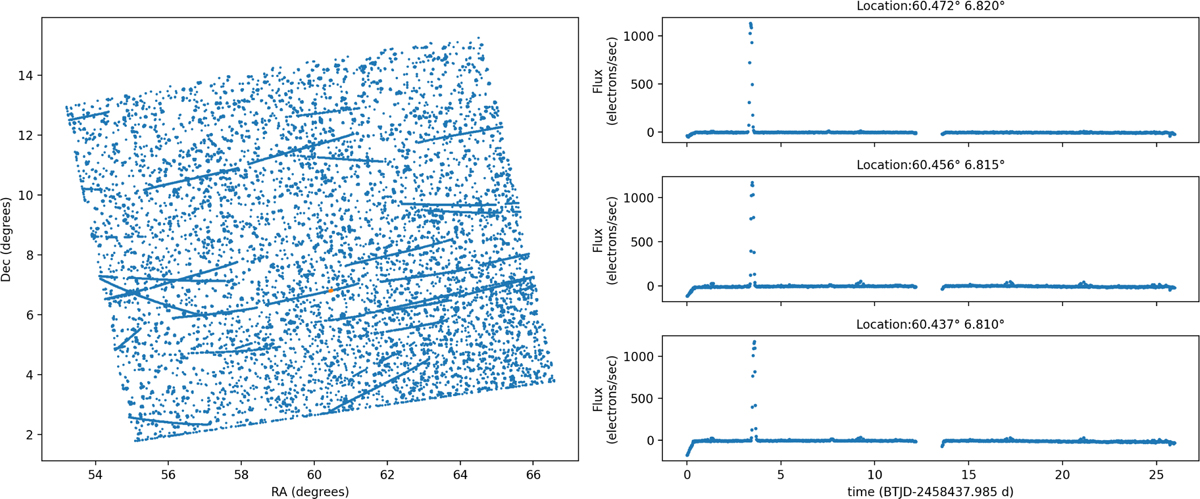
Left: on-sky plot of the extracted sources for CCD 4 of Camera 1 of sector 5. The streaks represent paths of Solar System objects as they cross the telescope’s field of view during the observation. Orange highlights the location of the three light curves in the right panel. Right: three light curves whose extraction was prompted by the asteroid 339 Dorothea (A892 SC) crossing the FOV at three consecutive epochs. The spikes represent the increase in flux due to the asteroid crossing the on-sky location of the light curves, where otherwise there is no light source.
Current usage metrics show cumulative count of Article Views (full-text article views including HTML views, PDF and ePub downloads, according to the available data) and Abstracts Views on Vision4Press platform.
Data correspond to usage on the plateform after 2015. The current usage metrics is available 48-96 hours after online publication and is updated daily on week days.
Initial download of the metrics may take a while.