Open Access
Fig. 6
Download original image
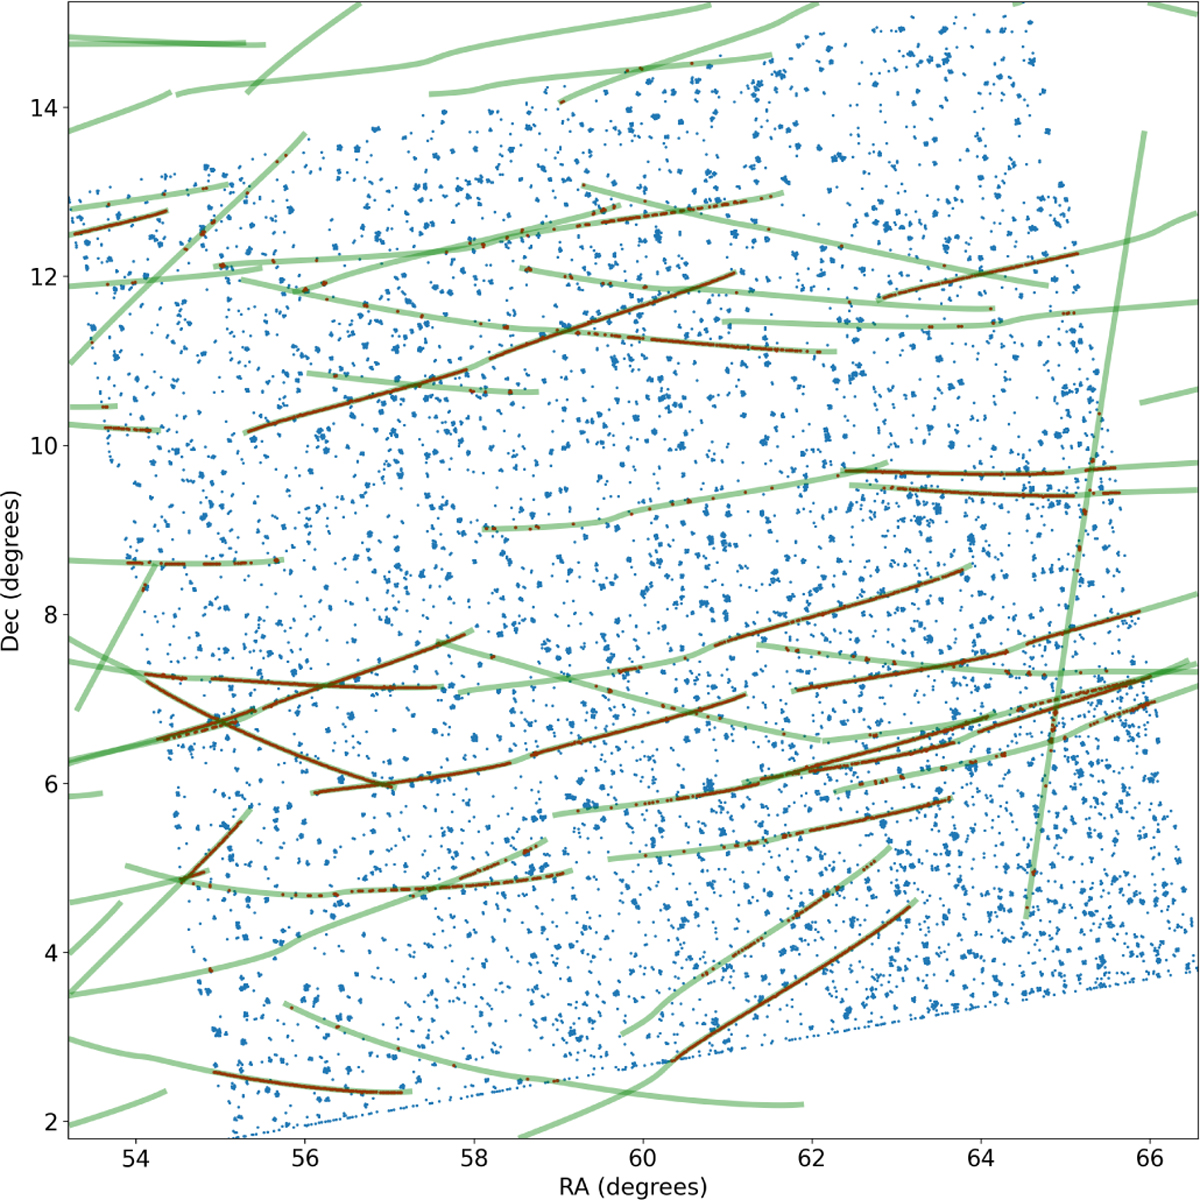
Extracted sources for CCD 4 of Camera 1 of sector 5 (blue dots). Green lines represent known SSO trajectories found using the Small-Body Identification Tool. Sources that are located less than one arcminute of such a trajectory are highlighted using the color red and receive the SSO contamination flag.
Current usage metrics show cumulative count of Article Views (full-text article views including HTML views, PDF and ePub downloads, according to the available data) and Abstracts Views on Vision4Press platform.
Data correspond to usage on the plateform after 2015. The current usage metrics is available 48-96 hours after online publication and is updated daily on week days.
Initial download of the metrics may take a while.