Open Access
Fig. 7
Download original image
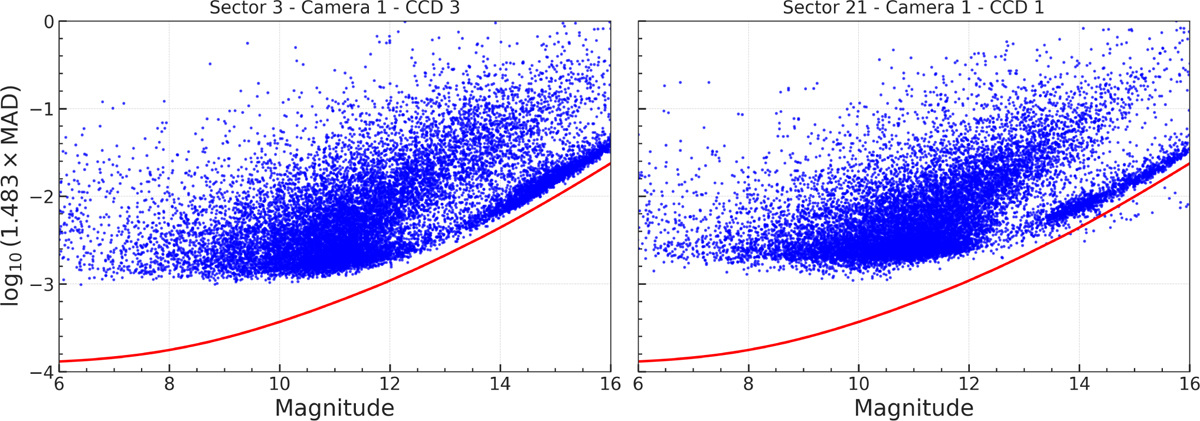
Samples of RMS (calculated as 1.483 × MAD) against magnitude plots of the light curve obtained from the CCD 3 Camera 1 in sector 3 (left) and the CCD 1 Camera 1 of sector 21 (right) compared to the prelaunch noise-level expectation from Sullivan et al. (2015) (solid red lines) scaled to 30-min FFIs cadence.
Current usage metrics show cumulative count of Article Views (full-text article views including HTML views, PDF and ePub downloads, according to the available data) and Abstracts Views on Vision4Press platform.
Data correspond to usage on the plateform after 2015. The current usage metrics is available 48-96 hours after online publication and is updated daily on week days.
Initial download of the metrics may take a while.