Fig. 1
Download original image
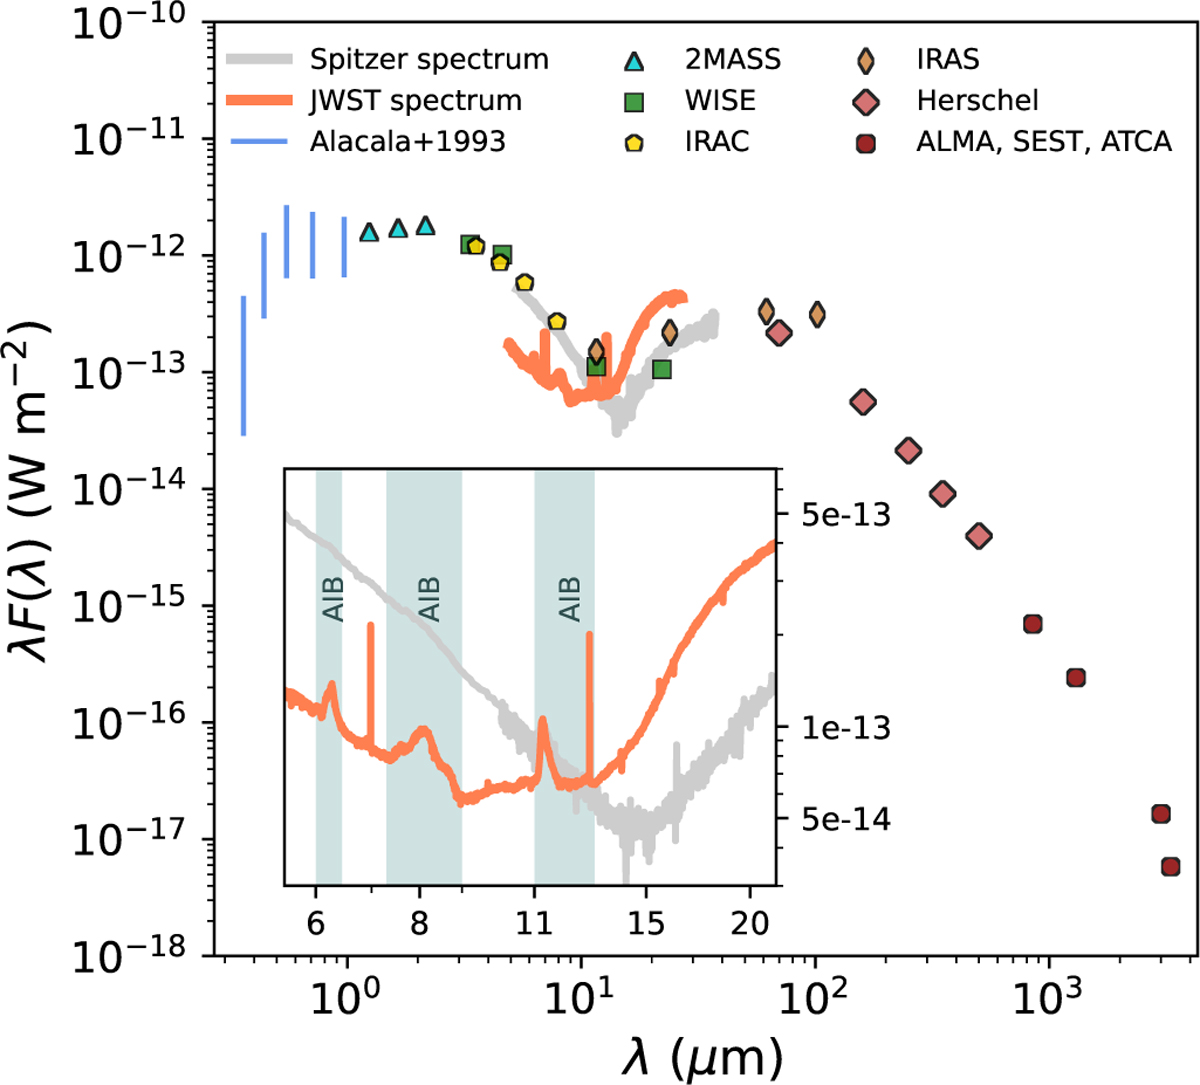
Collection of photometric fluxes and spectra of T Cha are shown. The blue vertical lines represent the variability in optical fluxes (Alcalá et al. 1993). IR photometric fluxes come from 2MASS, WISE, IRAC, IRAS, and Herschel. The millimetre band fluxes correspond to ALMA at 0.85 and 3 mm, SEST at 1.3 mm, and ATCA at 3.3 mm. The mid-IR spectra from Spitzer (grey) and JWST (orange) shows a varying continuum. Inset figure: AIBs at 6.2, 8.1, and 11.3 μm, prominently appearing in the JWST spectrum, are marked. The two strong lines in the JWST spectrum correspond to the fine-structure [Ar II] 6.98 μm and [Ne II] 12.81 μm transitions.
Current usage metrics show cumulative count of Article Views (full-text article views including HTML views, PDF and ePub downloads, according to the available data) and Abstracts Views on Vision4Press platform.
Data correspond to usage on the plateform after 2015. The current usage metrics is available 48-96 hours after online publication and is updated daily on week days.
Initial download of the metrics may take a while.