Open Access
Fig. D.7
Download original image
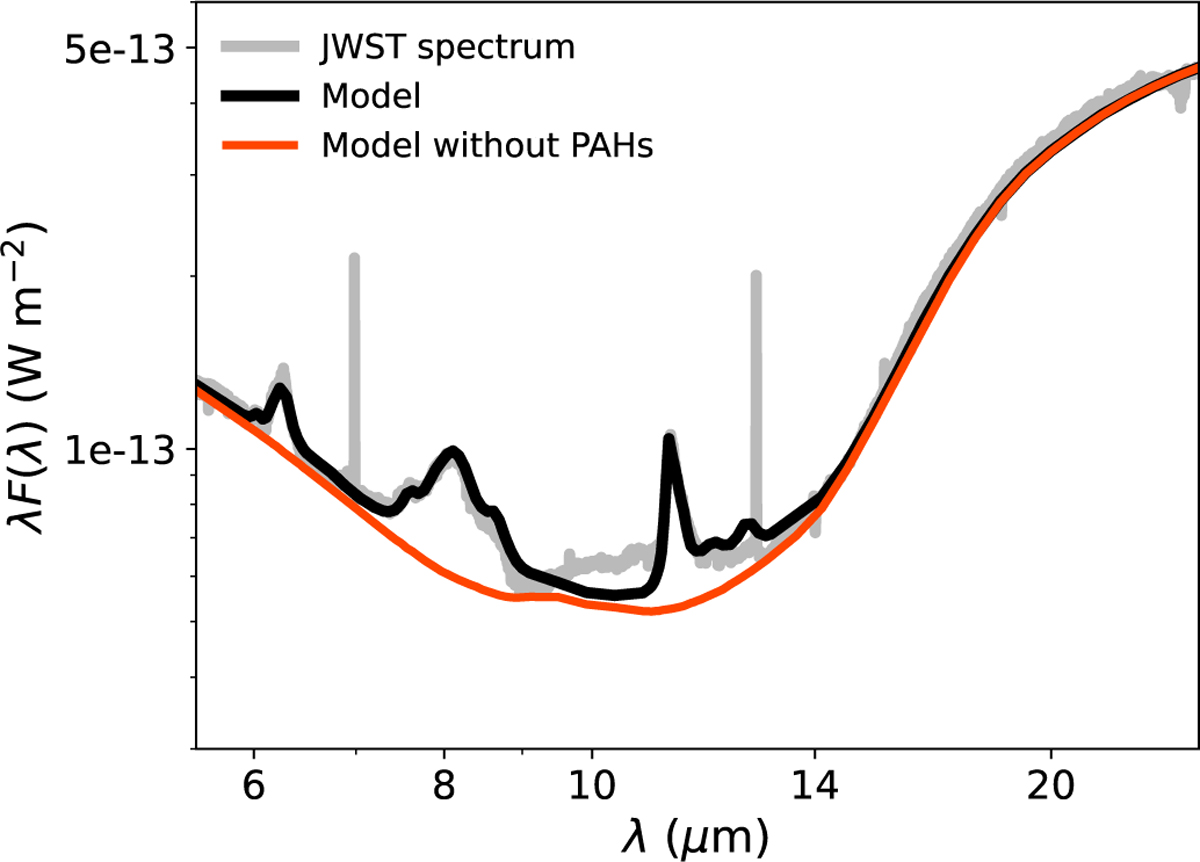
Comparison of the T Cha disk model computed in this paper (black) and the same model, but excluding the contribution of the PAHs to the modelled spectrum (red). Hence, this plot depicts the relative contribution of the PAHs to the thermal dust continuum.
Current usage metrics show cumulative count of Article Views (full-text article views including HTML views, PDF and ePub downloads, according to the available data) and Abstracts Views on Vision4Press platform.
Data correspond to usage on the plateform after 2015. The current usage metrics is available 48-96 hours after online publication and is updated daily on week days.
Initial download of the metrics may take a while.