Fig. 2
Download original image
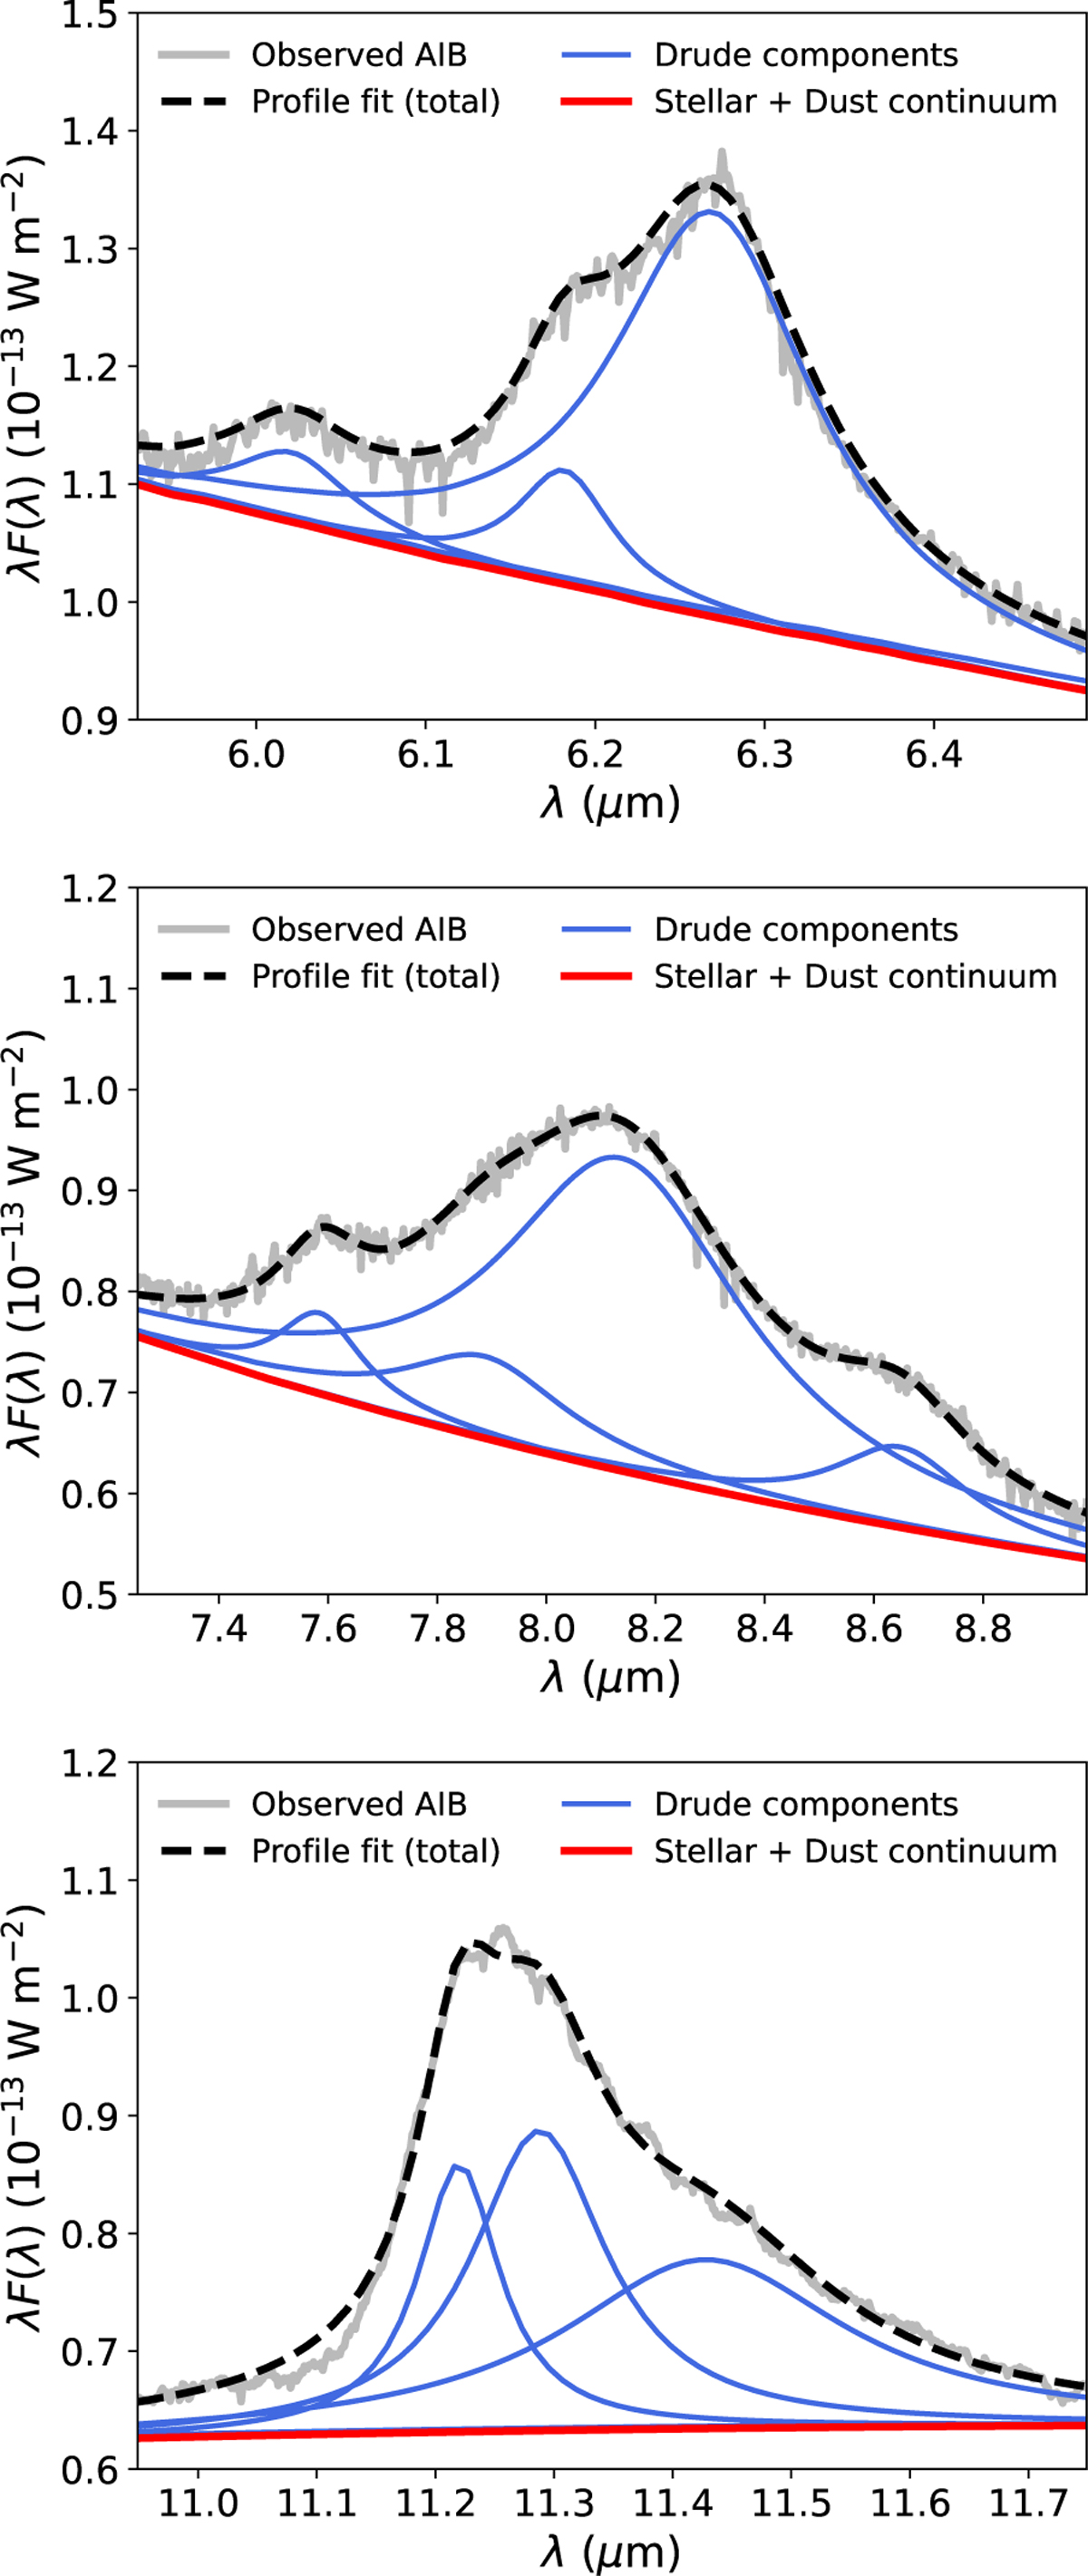
Spectral decomposition of the 6.2 (top), 8.1 (middle), and 11.3 (bottom) μm AIBs observed in the JWST spectrum of T Cha. Band profiles are fitted with Drude profile components (blue solid lines). The sum of the underlying stellar and dust continuum is shown in red solid line. The black dashed line shows the total fit to the AIB profiles. See more details in Sect. 4 and Appendix A.
Current usage metrics show cumulative count of Article Views (full-text article views including HTML views, PDF and ePub downloads, according to the available data) and Abstracts Views on Vision4Press platform.
Data correspond to usage on the plateform after 2015. The current usage metrics is available 48-96 hours after online publication and is updated daily on week days.
Initial download of the metrics may take a while.