Fig. 3
Download original image
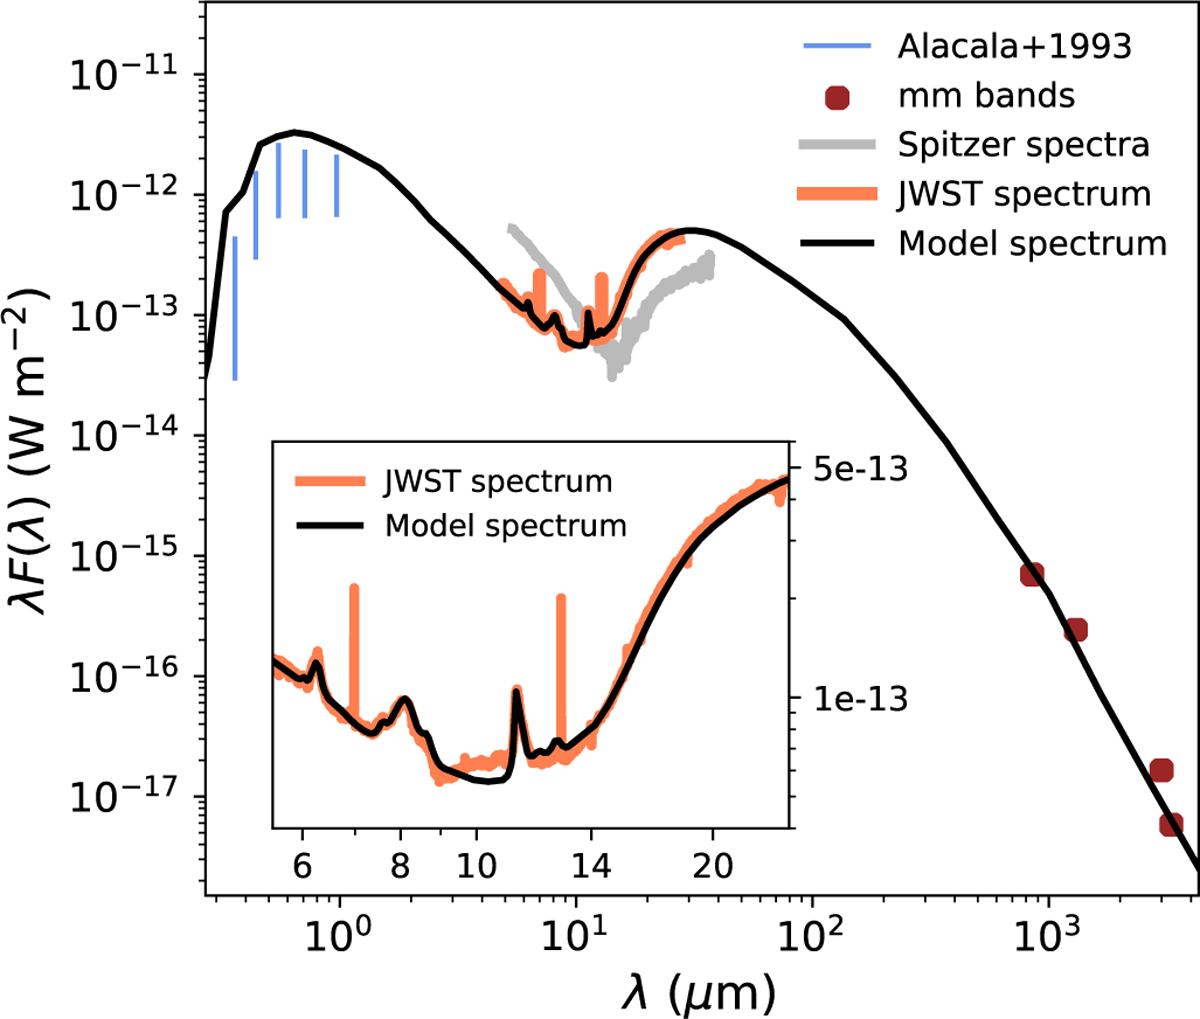
Model spectrum (black line, generated in a varying resolution across the wavelength range) is overplotted with the observed MIR JWST spectrum (orange line), optical photometric fluxes (blue vertical lines), and millimetre band fluxes (red circles). The MIR Spitzer spectrum (grey line) is shown as well for comparison. Inset plot: Fitting of the MIR continuum, along with the observed AIBs at 6.2, 8.1, and 11.3 μm, and the model generated continuum with the respective PAH bands, is shown in more detail.
Current usage metrics show cumulative count of Article Views (full-text article views including HTML views, PDF and ePub downloads, according to the available data) and Abstracts Views on Vision4Press platform.
Data correspond to usage on the plateform after 2015. The current usage metrics is available 48-96 hours after online publication and is updated daily on week days.
Initial download of the metrics may take a while.