Fig. 6
Download original image
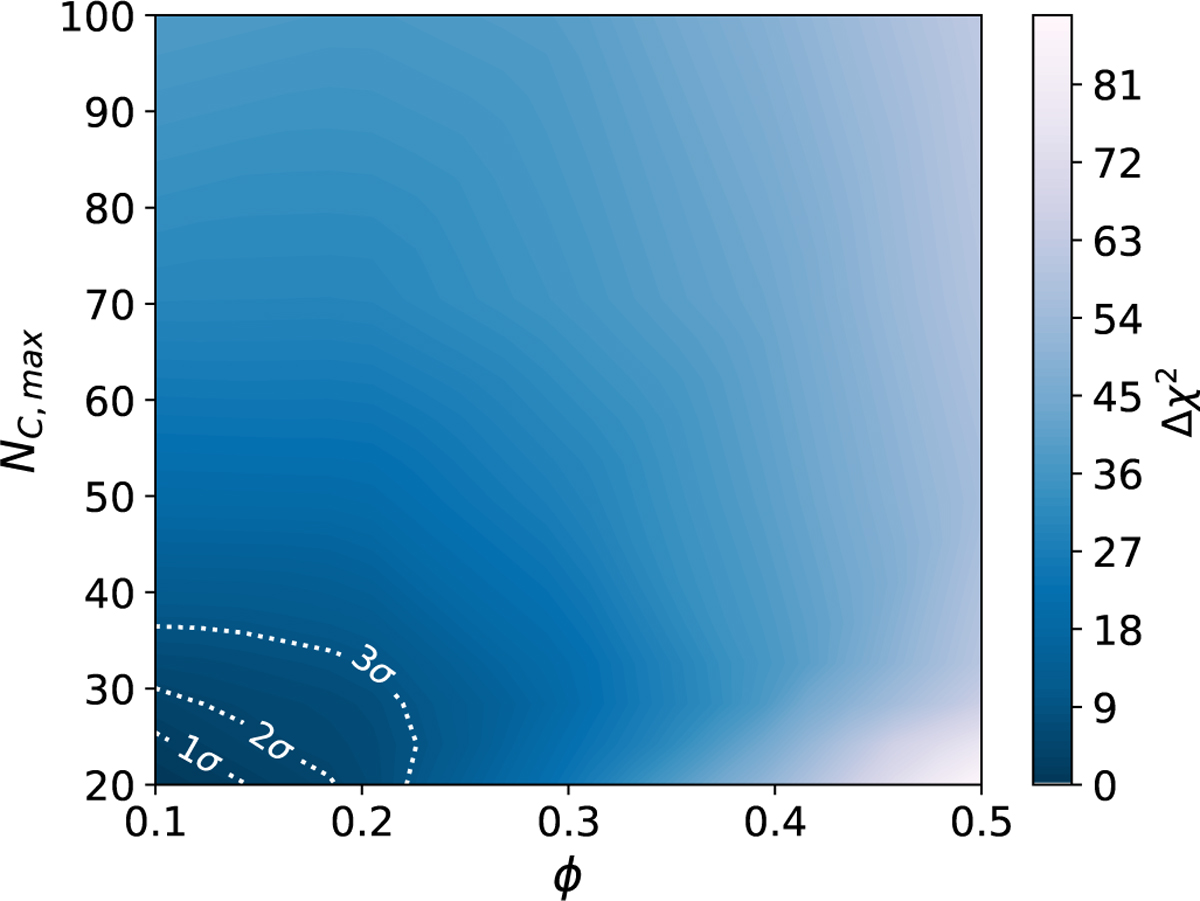
Δχ2 contours of the fits to the observed 6.2/8.1, 6.2/11.3, and 8.1/11.3 μm AIB ratios in NC,max − ϕ parameter space (for NC,min = 10 and fPAH = 20% corresponding to the minimum χ2 model, see text in Sect. 6.2.2). The σ levels are indicated with dotted contour lines. The 1σ contour helps in predicting the fiducial model values: NC = 10–26 and ϕ = 0.15, thereby estimating the final PAH-to-dust mass ratio as fPAH = 17% for the best fiducial model (Fig. 7 and Sect. 6.2.2).
Current usage metrics show cumulative count of Article Views (full-text article views including HTML views, PDF and ePub downloads, according to the available data) and Abstracts Views on Vision4Press platform.
Data correspond to usage on the plateform after 2015. The current usage metrics is available 48-96 hours after online publication and is updated daily on week days.
Initial download of the metrics may take a while.