Fig. 7
Download original image
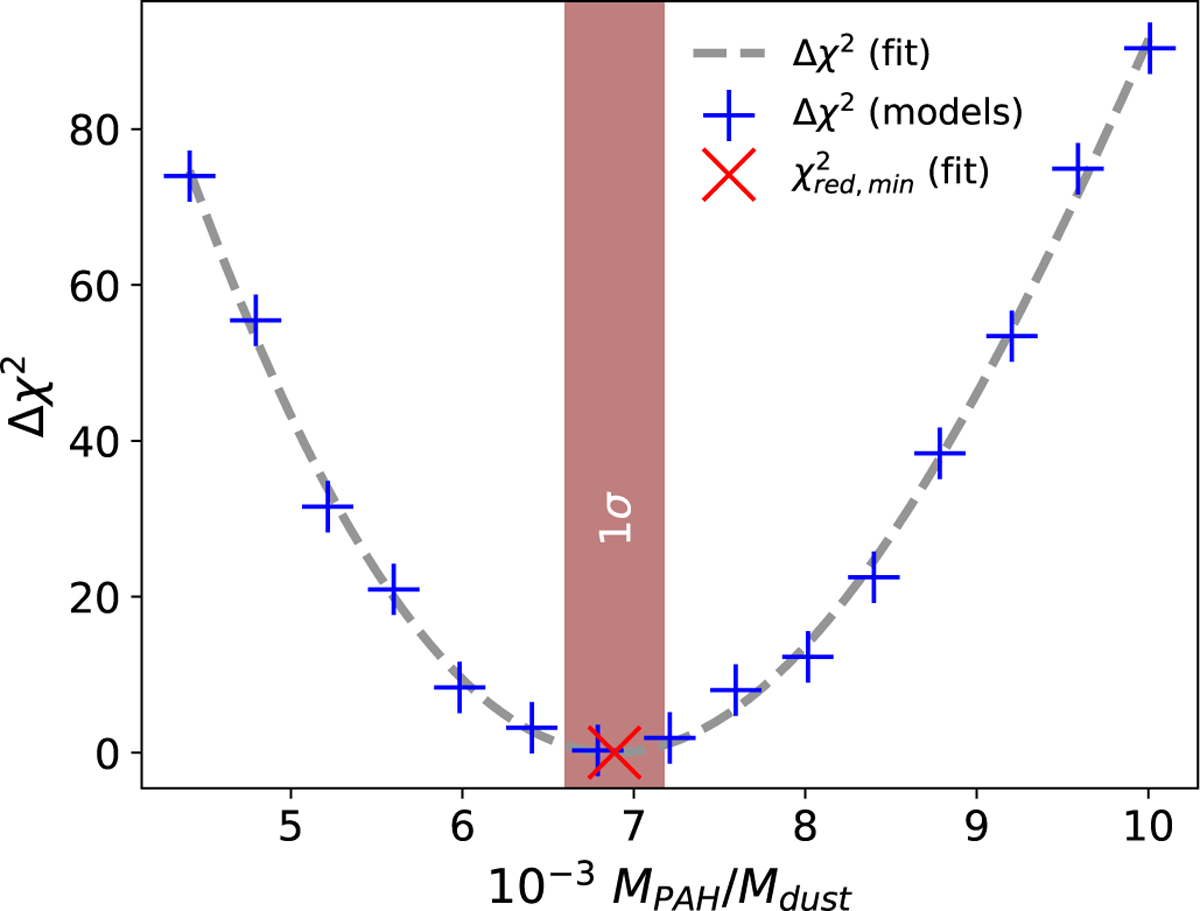
Plot of the Δχ2 values of the model fits with different PAH-to-dust mass ratios (MPAH/Mdust), while the rest of the model parameters are fixed to the best fiducial model, with optimised PAH size range (NC=10-26) and ionization fraction (ϕ=0.15), as discussed in Sect. 6.2.2, and that best fits the continuum (Sect. 6.1). The spectral regions covering the entire AIB profiles are used for the χ2 calculations. The minimum of the plot (Δχ2 = 0) corresponds to the minima of the fit through the χ2 values (also see text in Sect. 6.2.2). Hence, the light red shaded region with 0 ≤ Δχ2 ≤ 1, shows the 1σ confidence limit in the estimation of MPAH/Mdust, given the fiducial NC and ϕ values.
Current usage metrics show cumulative count of Article Views (full-text article views including HTML views, PDF and ePub downloads, according to the available data) and Abstracts Views on Vision4Press platform.
Data correspond to usage on the plateform after 2015. The current usage metrics is available 48-96 hours after online publication and is updated daily on week days.
Initial download of the metrics may take a while.