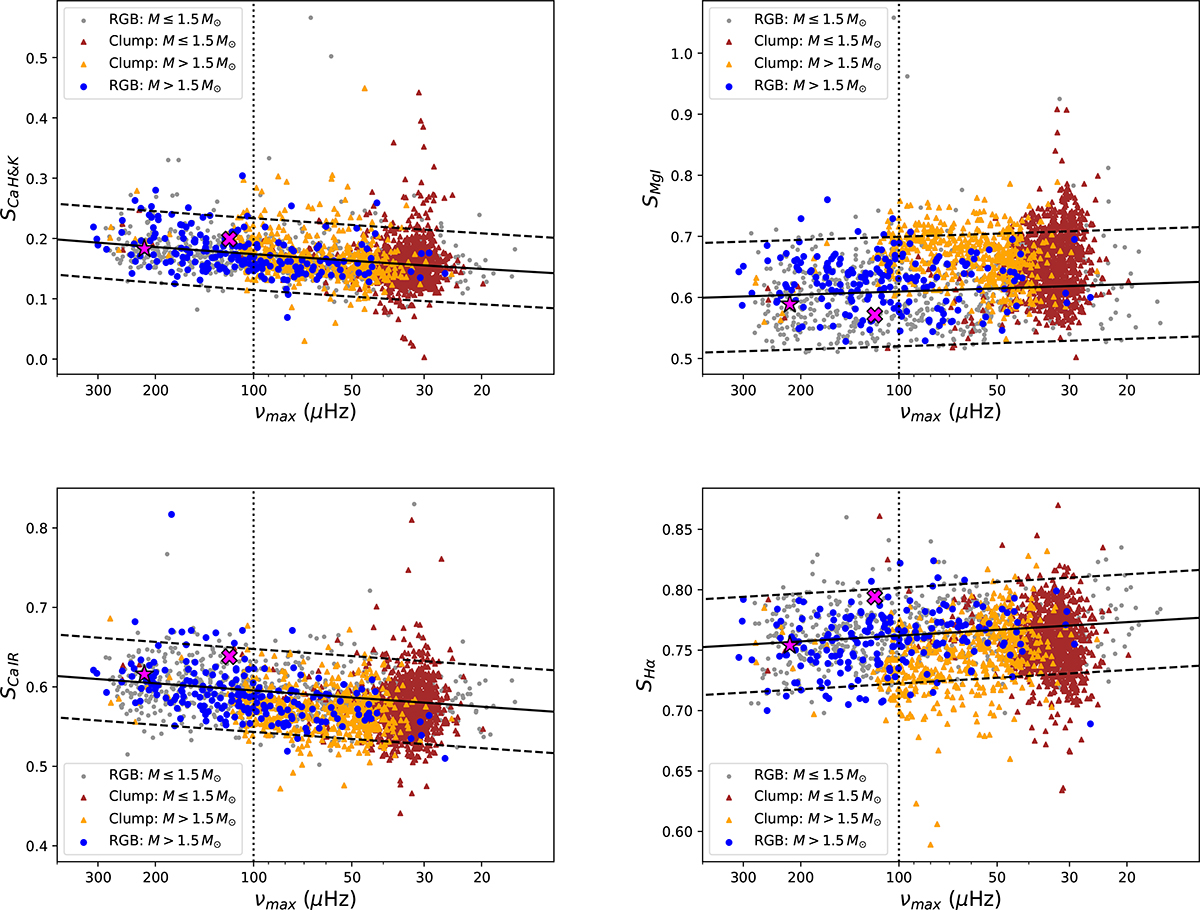
Fig. 1.
Download original image
Activity indicators as a function of νmax (inverted axis). LM and IM stars on the RGB are represented by grey and blue dots, respectively. LM and IM stars on the HB are represented by red and orange triangles, respectively. KIC 9267654 and KIC 9780154, which might have engulfed one or more planets since their surface rotates faster than their envelope, are shown with the magenta cross and star symbols, respectively. Vertical dotted lines indicate νmax = 100 μHz. Continuous and dashed lines represent a fit by a power law to the RGB stars and the corresponding 2σ prediction interval around the fit, respectively.
Current usage metrics show cumulative count of Article Views (full-text article views including HTML views, PDF and ePub downloads, according to the available data) and Abstracts Views on Vision4Press platform.
Data correspond to usage on the plateform after 2015. The current usage metrics is available 48-96 hours after online publication and is updated daily on week days.
Initial download of the metrics may take a while.