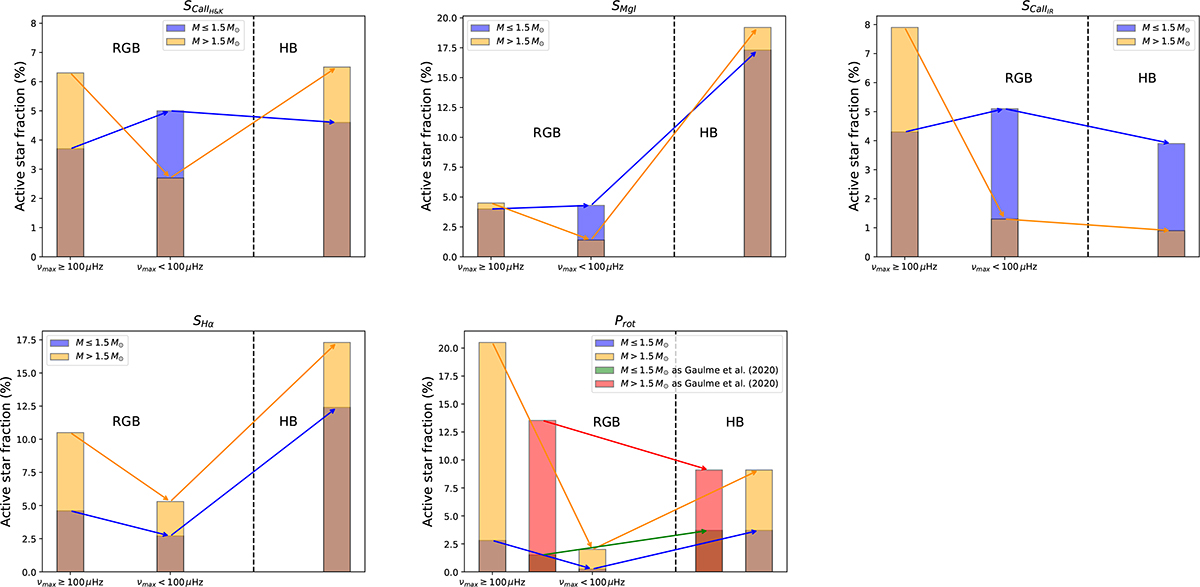
Fig. 2.
Download original image
Evolution of the active star fractions using different activity indicators from the lower RGB (νmax ≥ 100 μHz) to the medium RGB (νmax < 100 μHz) and the HB (on the right-hand side of the vertical dashed lines). Blue bars and arrows correspond to low-mass stars. Orange bars and arrows correspond to IM stars. Bottom panel indicates in addition the fractions of active LM (green bars and arrows) and IM (red bars and arrows) stars computed over the whole RGB without discriminating between the lower (νmax ≥ 100 μHz) and medium (νmax < 100 μHz) RGB.
Current usage metrics show cumulative count of Article Views (full-text article views including HTML views, PDF and ePub downloads, according to the available data) and Abstracts Views on Vision4Press platform.
Data correspond to usage on the plateform after 2015. The current usage metrics is available 48-96 hours after online publication and is updated daily on week days.
Initial download of the metrics may take a while.