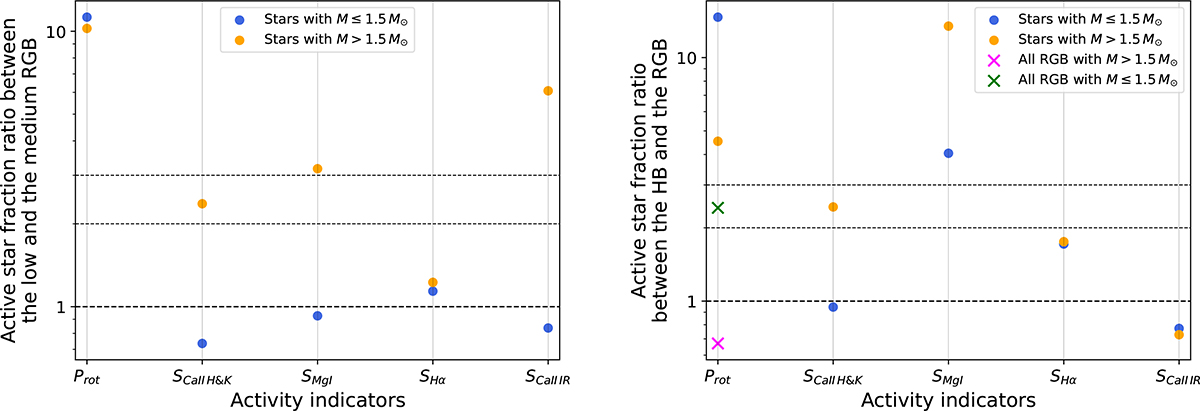
Fig. 3.
Download original image
Ratios between the fractions of active stars for different evolutionary stages for the different activity indicators used in this study (written on the x-axis). LM and IM stars are represented in blue and in orange, respectively. Horizontal dashed lines in bold indicate a ratio of 1, while the other horizontal dashed lines indicate ratios of 2 and 3. Left: Ratios between the low RGB (νmax ≥ 100 μHz) and the medium RGB (νmax < 100 μHz). Right: Ratios between the HB and the medium RGB. For RGs with detected Prot, we indicate in addition the ratios obtained for active LM (green cross) and IM (magenta cross) stars when considering stars across over the whole RGB without discriminating between the lower and medium RGB.
Current usage metrics show cumulative count of Article Views (full-text article views including HTML views, PDF and ePub downloads, according to the available data) and Abstracts Views on Vision4Press platform.
Data correspond to usage on the plateform after 2015. The current usage metrics is available 48-96 hours after online publication and is updated daily on week days.
Initial download of the metrics may take a while.