Fig. 2
Download original image
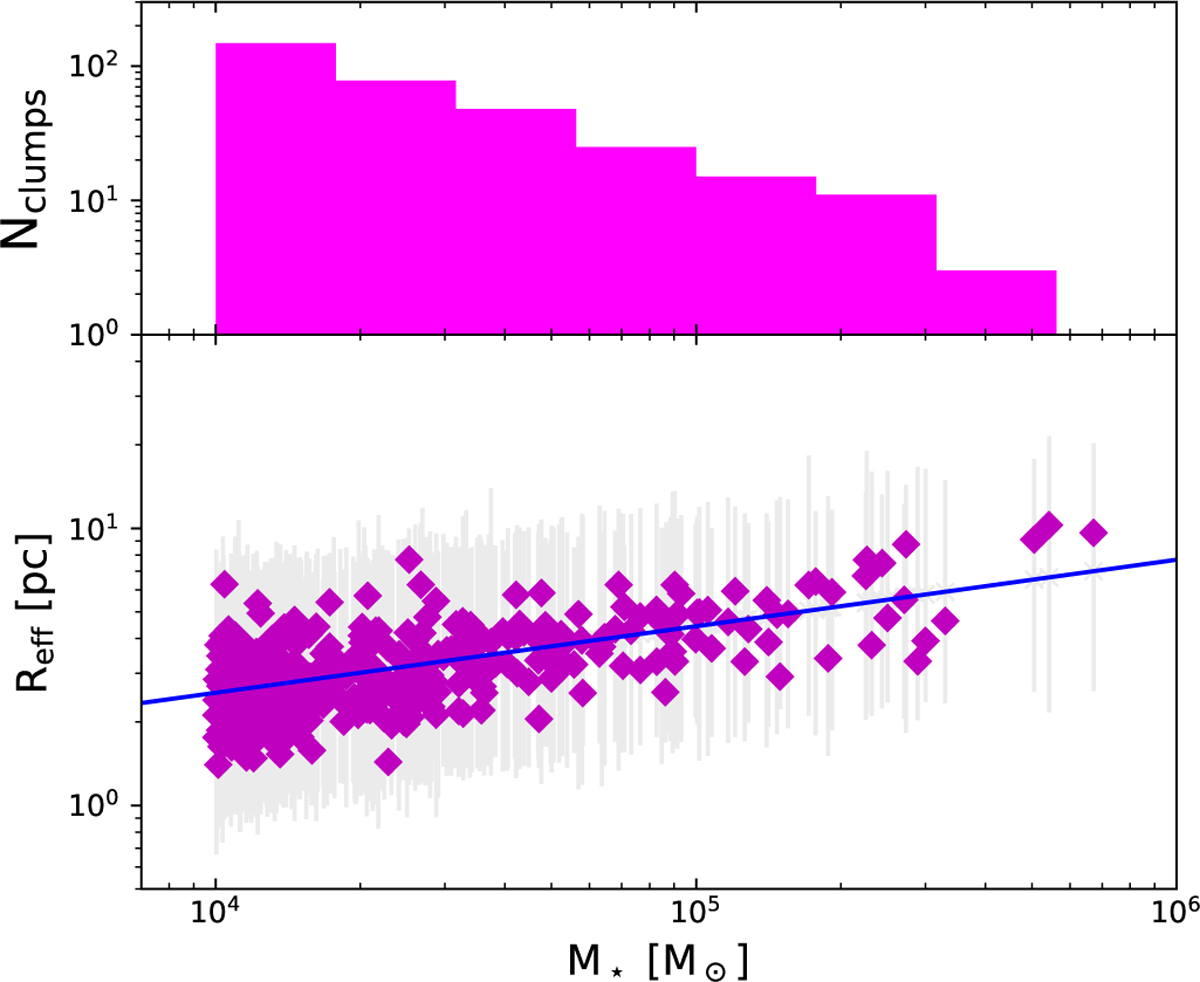
Upper panel: magenta histogram showing the stellar mass function of the star clumps populating our simulated galaxy. Lower panel: clump sizes (in units of parsec) as a function of the clump stellar mass. Clumps are represented by magenta points. The underlying average size-mass relation given by Eq. (12) (Brown & Gnedin 2021) is shown in a blue solid line. At a given stellar mass, we assume the size distribution follows a lognormal distribution with a standard deviation of σ = 0.3.
Current usage metrics show cumulative count of Article Views (full-text article views including HTML views, PDF and ePub downloads, according to the available data) and Abstracts Views on Vision4Press platform.
Data correspond to usage on the plateform after 2015. The current usage metrics is available 48-96 hours after online publication and is updated daily on week days.
Initial download of the metrics may take a while.