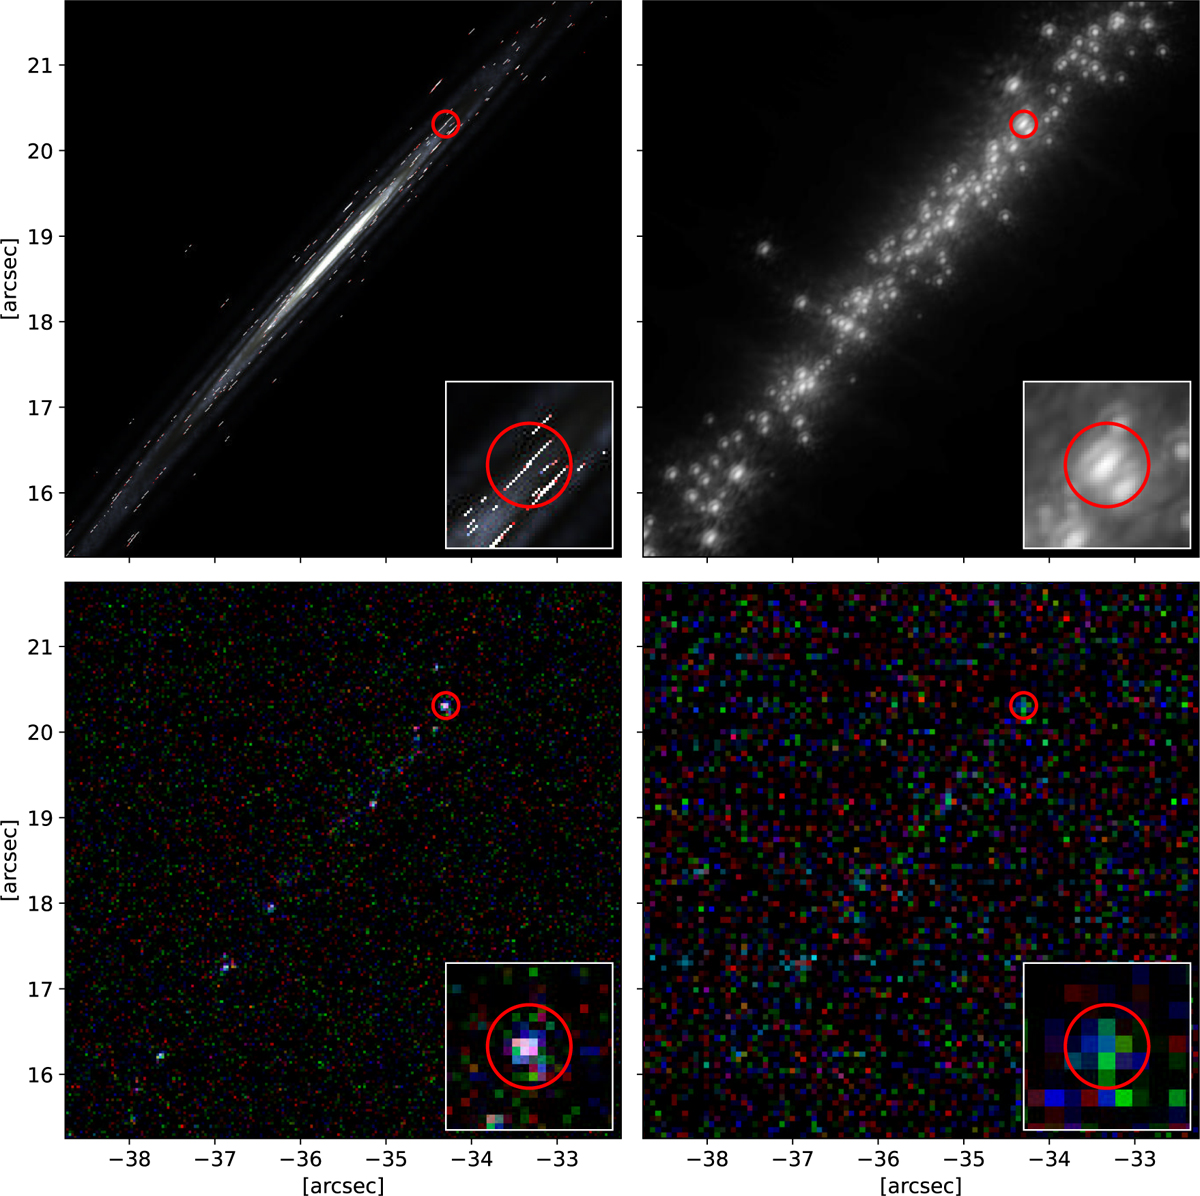
Fig. 6
Download original image
RGB simulation of the Cosmic Archipelago (z = 6.145), which is in MACS J0416.1-2403. This is the same source shown in the right panel of Fig. 1, but including strong lensing effects by MACS J0416.1-2403. The unlensed source is assumed to be at z = 6.145 and distorted into a gravitational arc if placed near the cluster tangential caustic. Top left: a high-resolution RGB simulation (2.5 mas/pix), where the red, green, and blue channels correspond to wavelengths of λe = 5, 3, and 2 μm, respectively; top right: the same high-resolution image, but monochromatic, constructed using the magnitudes of the host and the clumps in the JWST/F115W filter and convolved with the JWST/F115W PSF to illustrate the effect of instrumental resolution; bottom left: an RGB image created by combining three JWST NIRCam short wavelength channels (red F200W, green F150W, and blue F115W), including realistic noise and sky background; bottom right: an RGB image created by combining three JWST NIRCam long wavelength channels (red F444W, green F356W, and blue F277W), including realistic noise and sky background. The background level and effective exposure time are based on real JWST observations of MACS J0416.1-2403 and are listed in Table 2. The red circle in each image highlights an example of a clump, illustrating how the instrument’s resolution is a limiting factor: while clumps appear as distinct structures in the HR image (see the zoom-in region shown at the bottom right of the figure), they become blended together in the JWST observations. For each image, the origin of the coordinate system coincides with the center of the cluster, located at (RA: 64.038142 deg, Dec: −24.067472 deg).
Current usage metrics show cumulative count of Article Views (full-text article views including HTML views, PDF and ePub downloads, according to the available data) and Abstracts Views on Vision4Press platform.
Data correspond to usage on the plateform after 2015. The current usage metrics is available 48-96 hours after online publication and is updated daily on week days.
Initial download of the metrics may take a while.