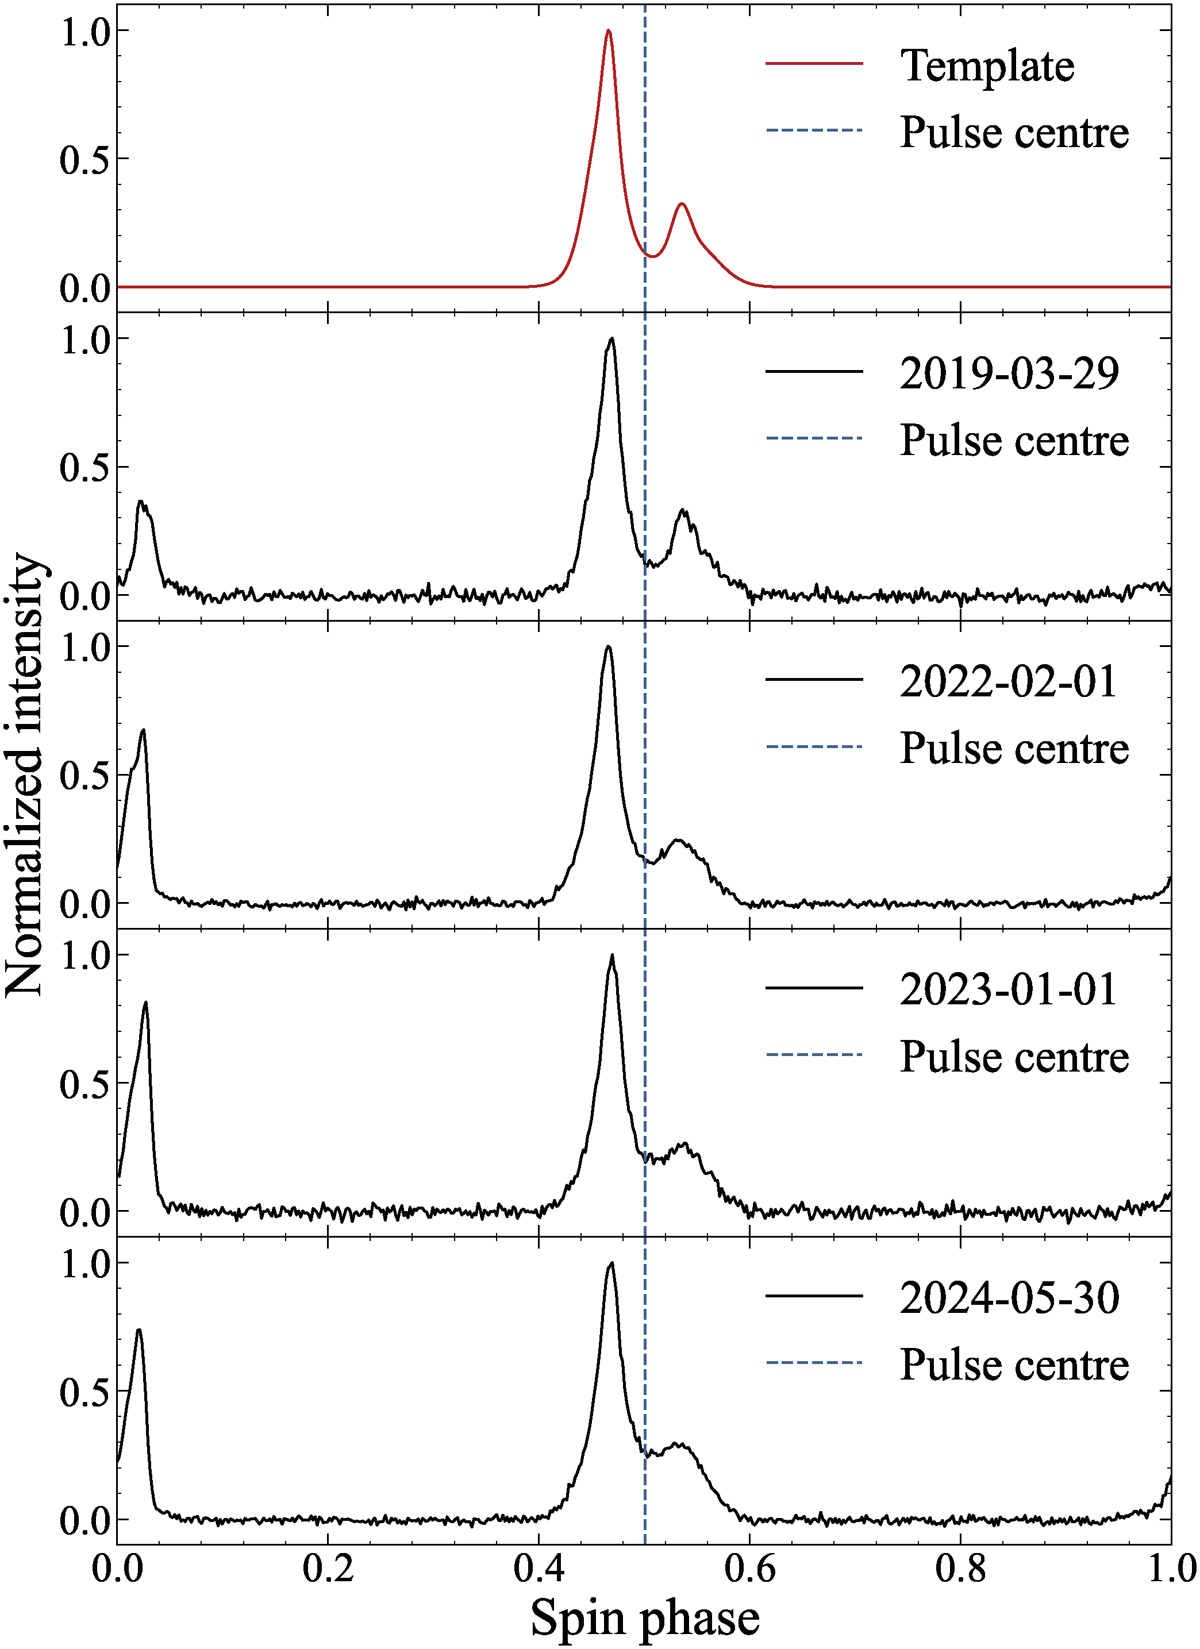
Fig. 1.
Download original image
Frequency-averaged template used to fit ToAs and some examples of the observed pulse profile (Stokes I) displayed in red and black solid lines, respectively. We generated the template with the pulse profile of 2019-03-29 and aligned each profile with the centre of the two Gaussian functions that we used to fit the pulse, indicated by the blue dashed lines. The less severe profile evolution in the main pulse can be seen in this figure compared to that in the interpulse, which makes it reasonable to fit ToAs only with the main pulse. One can also notice that the separation between the main pulse and the interpulse is increasing over time.
Current usage metrics show cumulative count of Article Views (full-text article views including HTML views, PDF and ePub downloads, according to the available data) and Abstracts Views on Vision4Press platform.
Data correspond to usage on the plateform after 2015. The current usage metrics is available 48-96 hours after online publication and is updated daily on week days.
Initial download of the metrics may take a while.