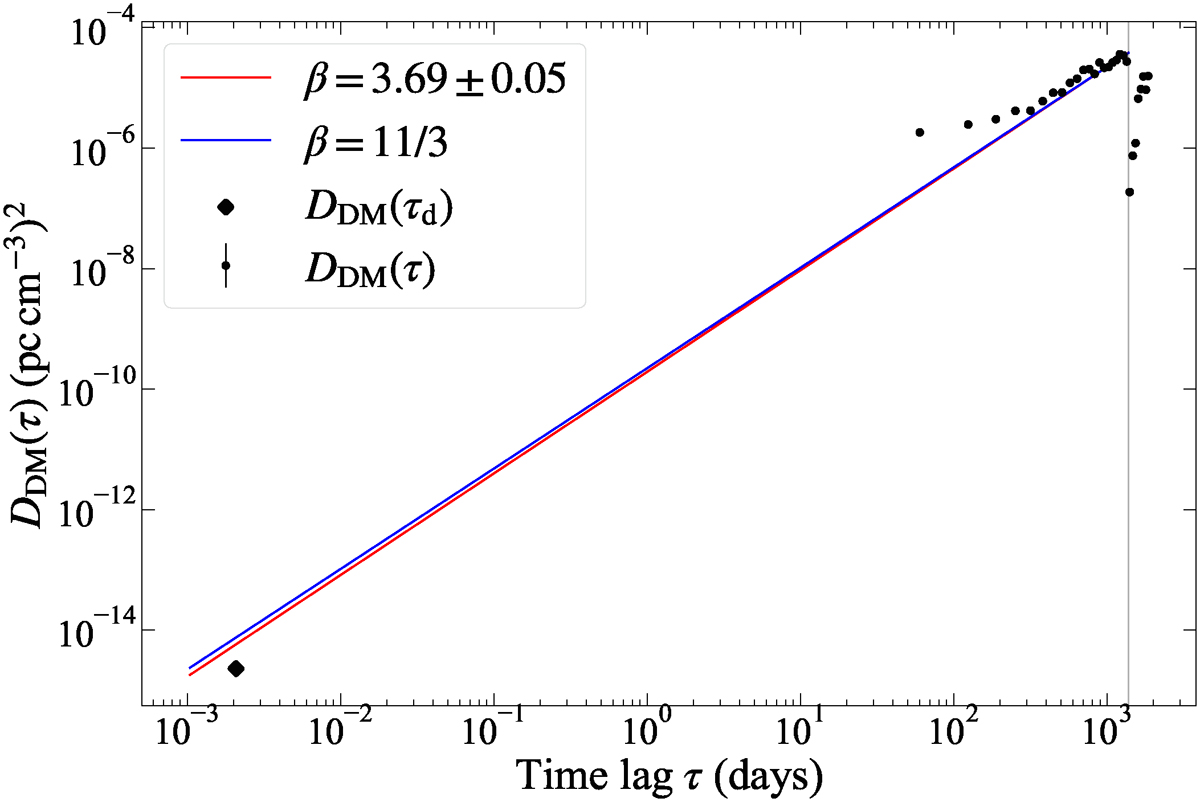
Fig. A.1.
Download original image
Measurements of DM structure functions as a function of time lag are displayed in black circles. The black diamond represents the DM structure function when the time lag equals the time scale of DISS (τd ≈ 3 minutes), which is included in the fitting. The red and blue dashed lines are the fitting result with Dϕ(τ)∝τβ − 2 and fixed β of 11/3, respectively. Only points to the left of the grey line are involved in the fitting due to the possible bias introduced by the sudden decrease.
Current usage metrics show cumulative count of Article Views (full-text article views including HTML views, PDF and ePub downloads, according to the available data) and Abstracts Views on Vision4Press platform.
Data correspond to usage on the plateform after 2015. The current usage metrics is available 48-96 hours after online publication and is updated daily on week days.
Initial download of the metrics may take a while.