Fig. 2.
Download original image
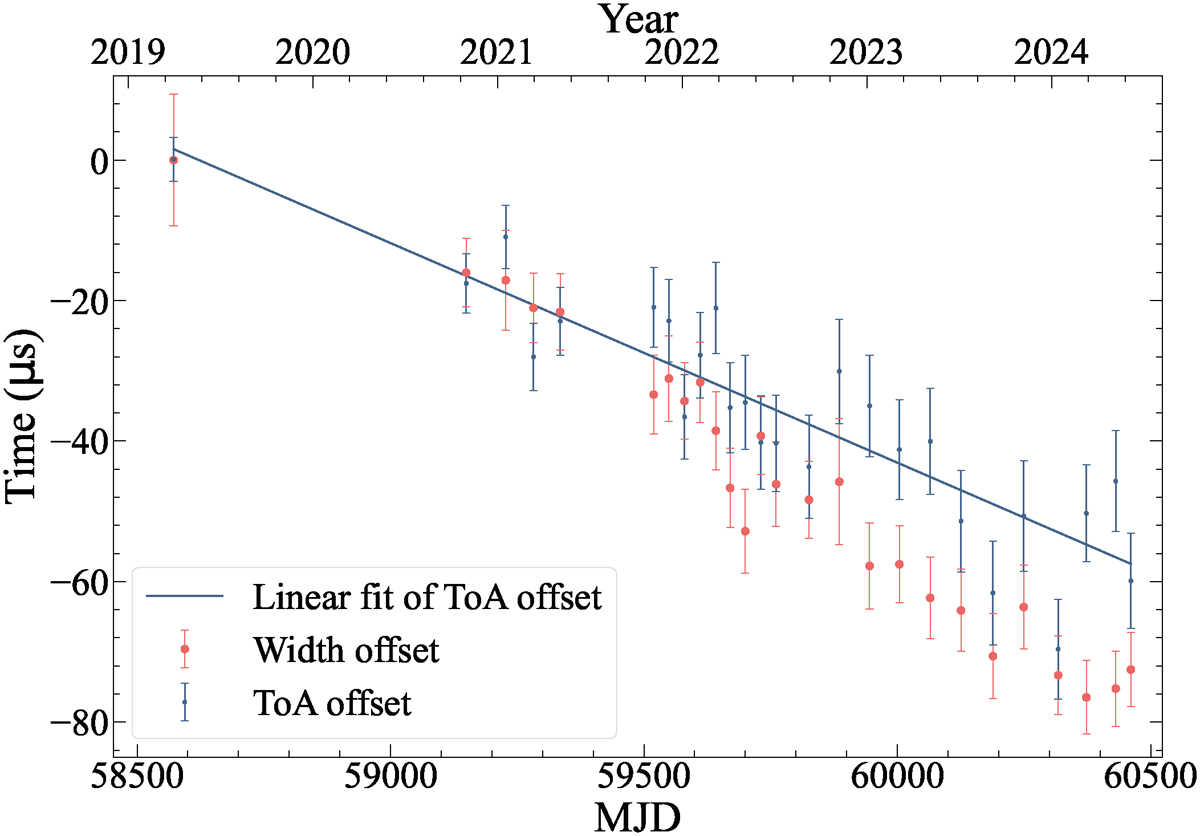
Time-of-arrival offsets derived from the standard template of the first observation and the integrated pulse profile displayed with blue points. The pulse width (the unit is the same as the ToA offset) of each integrated pulse profile is plotted with red points. The correlation between the ToA offsets and pulse widths indicates the strong influence introduced by the profile evolution on measuring the ToAs. The blue solid line is the linear fit between MJD and ToA offsets, which is used to correct ToAs.
Current usage metrics show cumulative count of Article Views (full-text article views including HTML views, PDF and ePub downloads, according to the available data) and Abstracts Views on Vision4Press platform.
Data correspond to usage on the plateform after 2015. The current usage metrics is available 48-96 hours after online publication and is updated daily on week days.
Initial download of the metrics may take a while.