Fig. 3.
Download original image
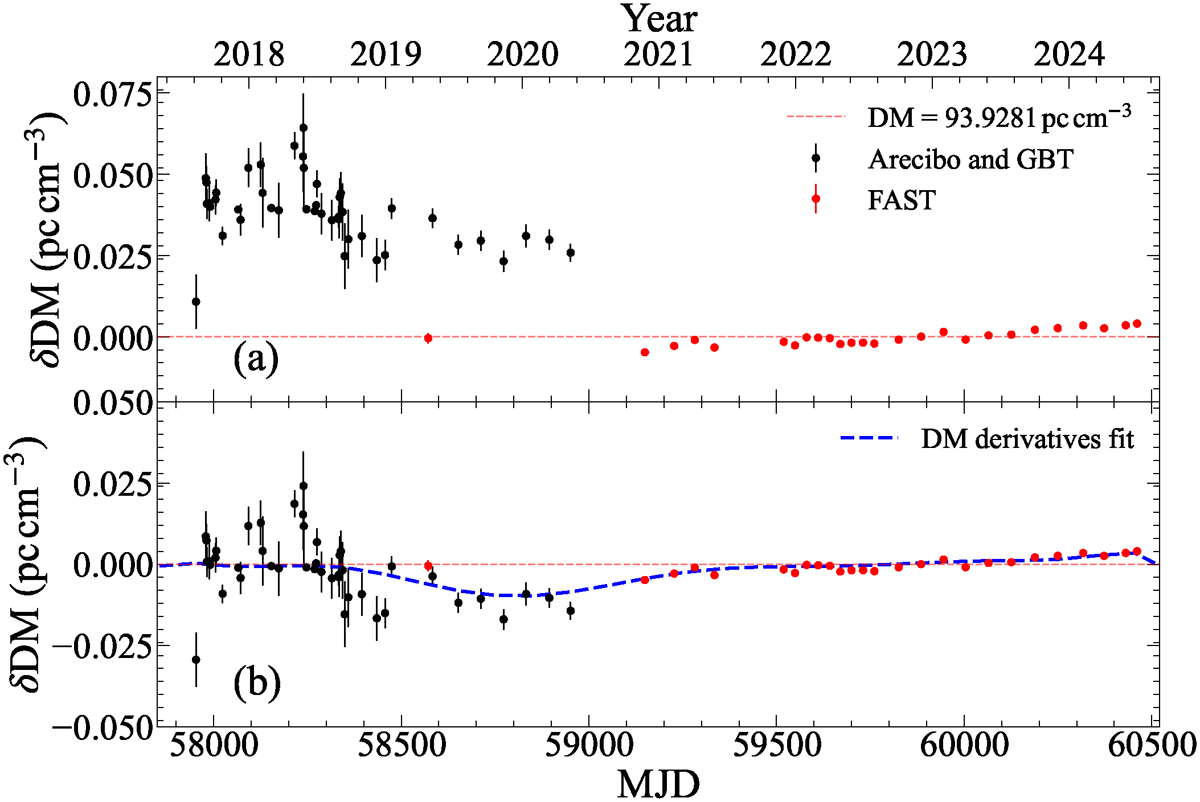
Dispersion measure variations derived from the DMX model with a time bin of 1 day. Panels (a) and (b) represent the DM variation before and after the DM correction, respectively. DM measurements from Arecibo and GBT are represented by black points, and those from FAST are represented by red points. The red dashed line indicates the final measurement of the DM, which is 93.9281 pc cm−3. We display the 10-order DM derivative fit in panel (b) with the blue dashed line.
Current usage metrics show cumulative count of Article Views (full-text article views including HTML views, PDF and ePub downloads, according to the available data) and Abstracts Views on Vision4Press platform.
Data correspond to usage on the plateform after 2015. The current usage metrics is available 48-96 hours after online publication and is updated daily on week days.
Initial download of the metrics may take a while.