Fig. 7.
Download original image
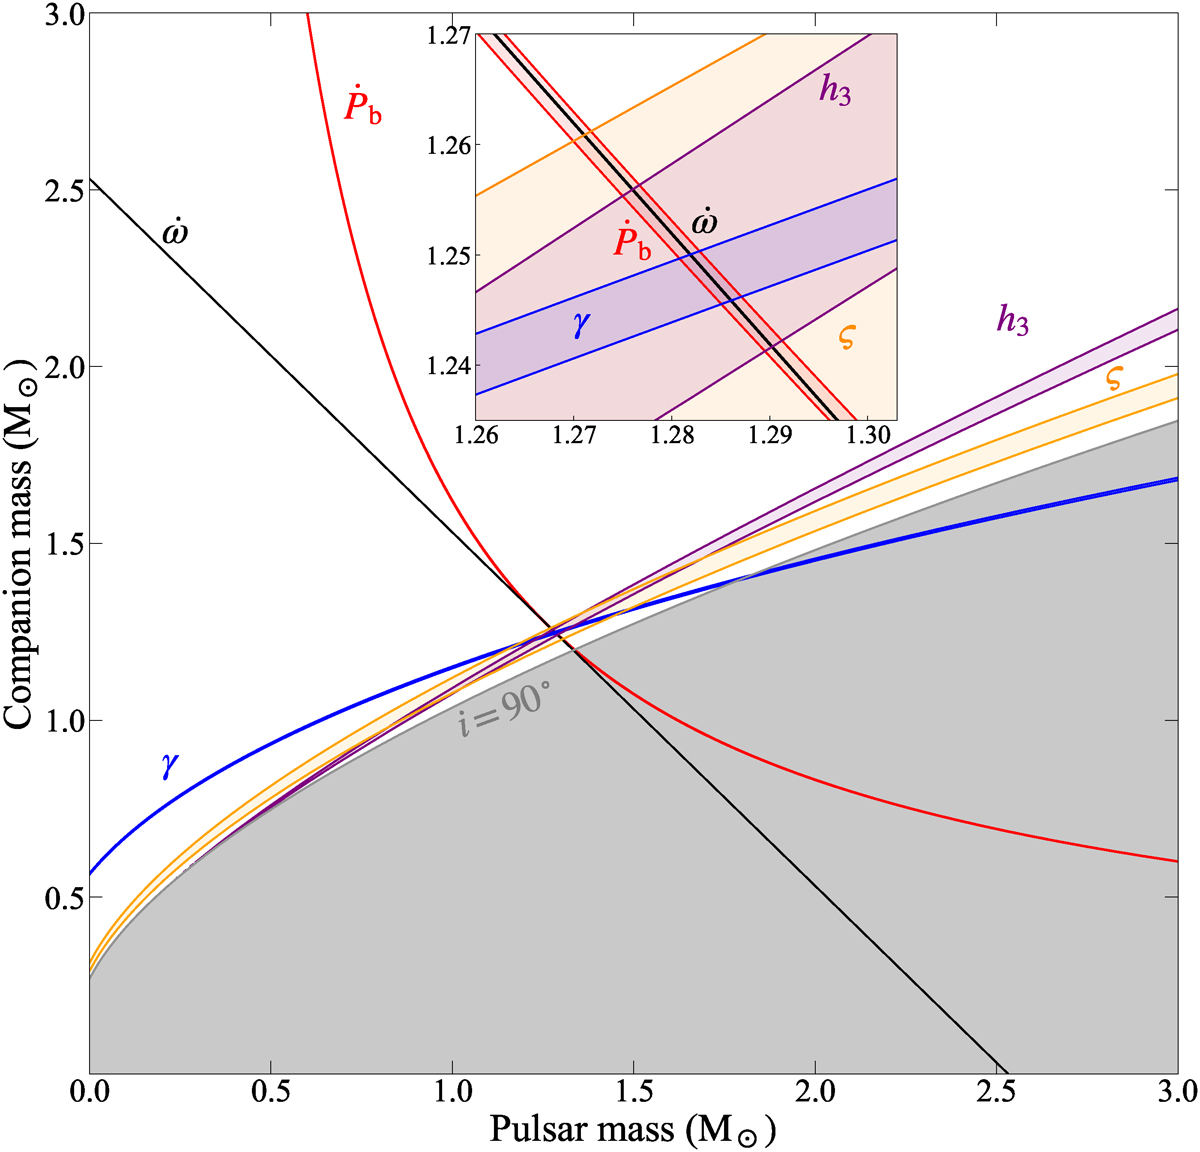
Mass-mass diagram for PSR J1946+2052. The regions consistent with the measured ![]() , and their 1-σ uncertainties are displayed in red, green, blue, purple, and orange. Note that Ṗb in this diagram has been corrected by removing the external contributions. The grey area is excluded by the mass function and sin i ≤ 1. The inset is an expanded view, showing in more detail the intersection of all PK parameters and the self-consistency of GR. The
, and their 1-σ uncertainties are displayed in red, green, blue, purple, and orange. Note that Ṗb in this diagram has been corrected by removing the external contributions. The grey area is excluded by the mass function and sin i ≤ 1. The inset is an expanded view, showing in more detail the intersection of all PK parameters and the self-consistency of GR. The ![]() -line is based on the leading-order Equation (4). The (small) modifications related to the next-to-leading order contributions to the periastron advance are discussed in detail in Sect. 4.4.
-line is based on the leading-order Equation (4). The (small) modifications related to the next-to-leading order contributions to the periastron advance are discussed in detail in Sect. 4.4.
Current usage metrics show cumulative count of Article Views (full-text article views including HTML views, PDF and ePub downloads, according to the available data) and Abstracts Views on Vision4Press platform.
Data correspond to usage on the plateform after 2015. The current usage metrics is available 48-96 hours after online publication and is updated daily on week days.
Initial download of the metrics may take a while.