Fig. 8.
Download original image
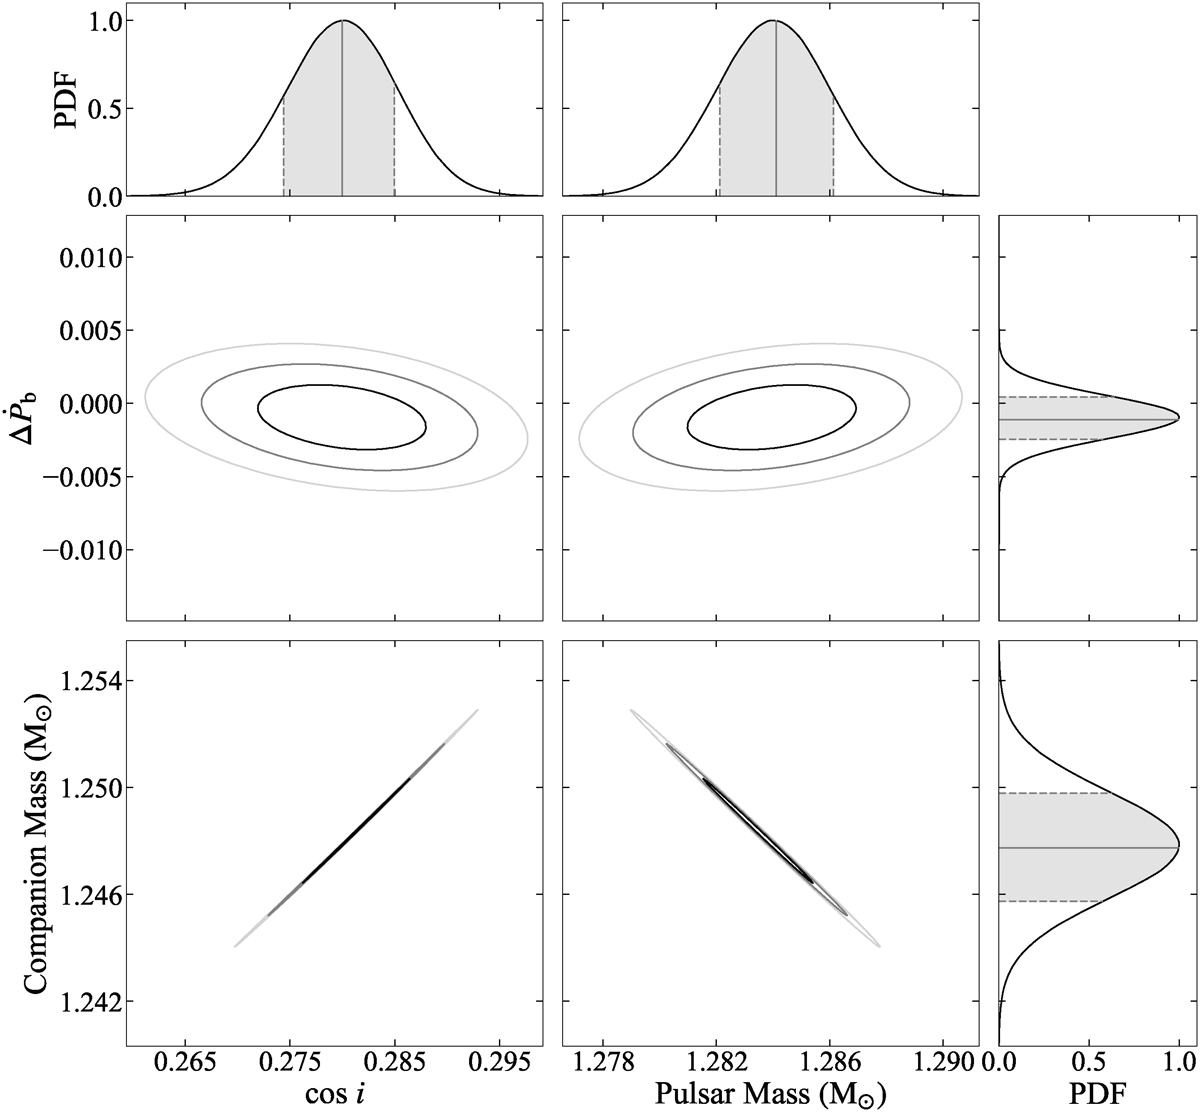
Constraints on the orbital inclination angle, masses of the pulsar and the companion, and the Ṗb deviation from the measurement and the prediction of GR (ΔṖb). The black, grey, and light grey contours represent the 1-σ, 2-σ, and 3-σ confidence levels of these parameters. We show the probability density of each parameter on the upper and right edges, where the grey area and solid grey line represent the 1-σ confidence area and the nominal values; the dashed lines at the edges represent the ±1-σ limits.
Current usage metrics show cumulative count of Article Views (full-text article views including HTML views, PDF and ePub downloads, according to the available data) and Abstracts Views on Vision4Press platform.
Data correspond to usage on the plateform after 2015. The current usage metrics is available 48-96 hours after online publication and is updated daily on week days.
Initial download of the metrics may take a while.