Fig. 4
Download original image
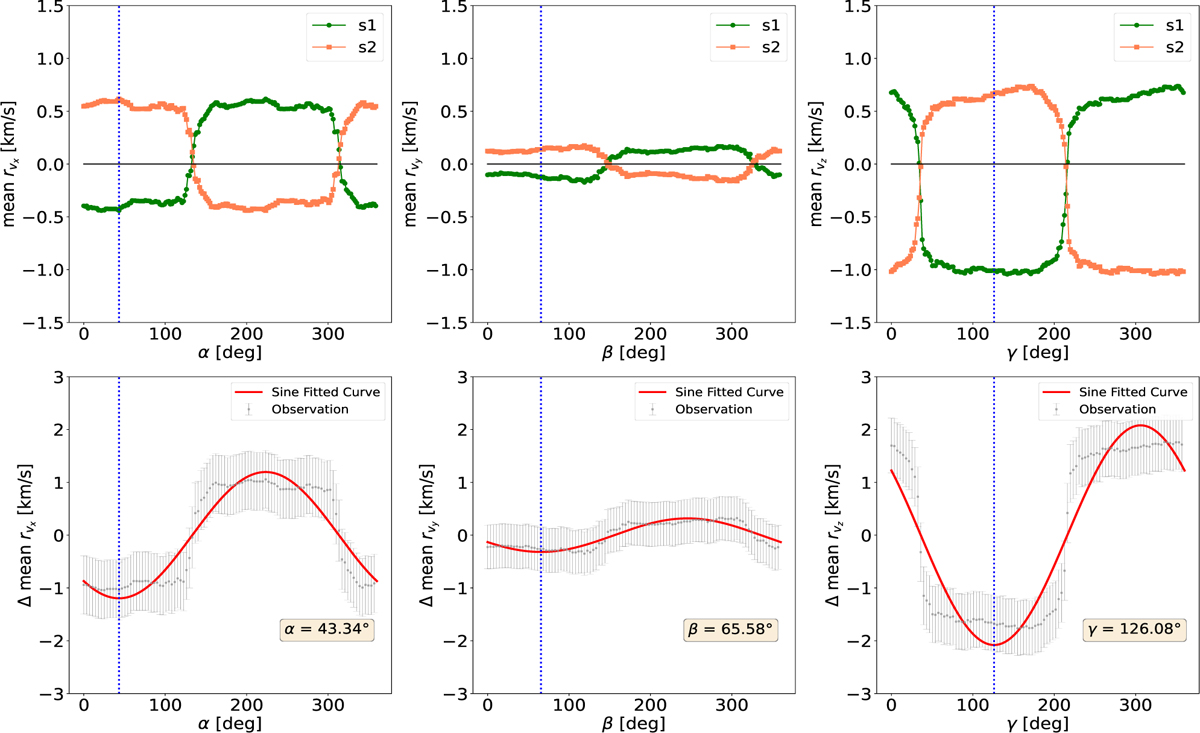
Mean residual velocities shown as a function of the three position angles (α, β, γ) for the two subsamples in the top panel for M 67 within 5rJ. Difference (∆) in the mean residual velocities (![]() ,
, ![]() , and
, and ![]() ) of the two subsamples is displayed as a function of the position angles (PA) in the bottom panel. Error bars (in gray), best-fitting sine functions (in red), and the initially fitted angles are also shown.
) of the two subsamples is displayed as a function of the position angles (PA) in the bottom panel. Error bars (in gray), best-fitting sine functions (in red), and the initially fitted angles are also shown.
Current usage metrics show cumulative count of Article Views (full-text article views including HTML views, PDF and ePub downloads, according to the available data) and Abstracts Views on Vision4Press platform.
Data correspond to usage on the plateform after 2015. The current usage metrics is available 48-96 hours after online publication and is updated daily on week days.
Initial download of the metrics may take a while.