Fig. 1.
Download original image
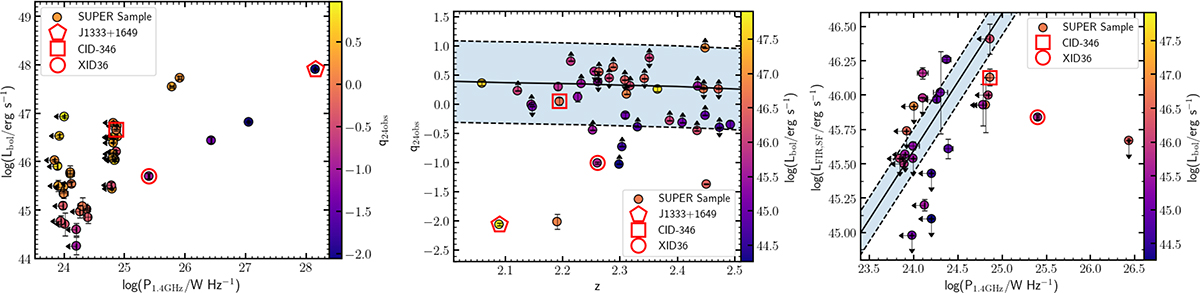
Properties of the SUPER sample highlighting the three targets of this work. Left: Bolometric luminosity (Lbol) vs. radio power at 1.4 GHz. The color bar shows the q24obs parameter, where q24obs = log(S24 μm/Sr). S24 μm and Sr are the observed 24 μm and 1.4 GHz flux densities. Middle: q24obs parameter vs. redshift. The color bar shows the bolometric luminosity. The solid line represents the typical values for a star-forming galaxy (M32; from Bonzini et al. 2013), while the dashed lines indicate the ±2σ dispersion, which marks the locus of star-forming galaxies. Right: FIR luminosities vs. radio power at 1.4 GHz. The solid line is from Magnelli et al. (2015) and the dashed lines represent 2σ relative to the solid line. The color bar shows the bolometric luminosity.
Current usage metrics show cumulative count of Article Views (full-text article views including HTML views, PDF and ePub downloads, according to the available data) and Abstracts Views on Vision4Press platform.
Data correspond to usage on the plateform after 2015. The current usage metrics is available 48-96 hours after online publication and is updated daily on week days.
Initial download of the metrics may take a while.