Fig. E.1.
Download original image
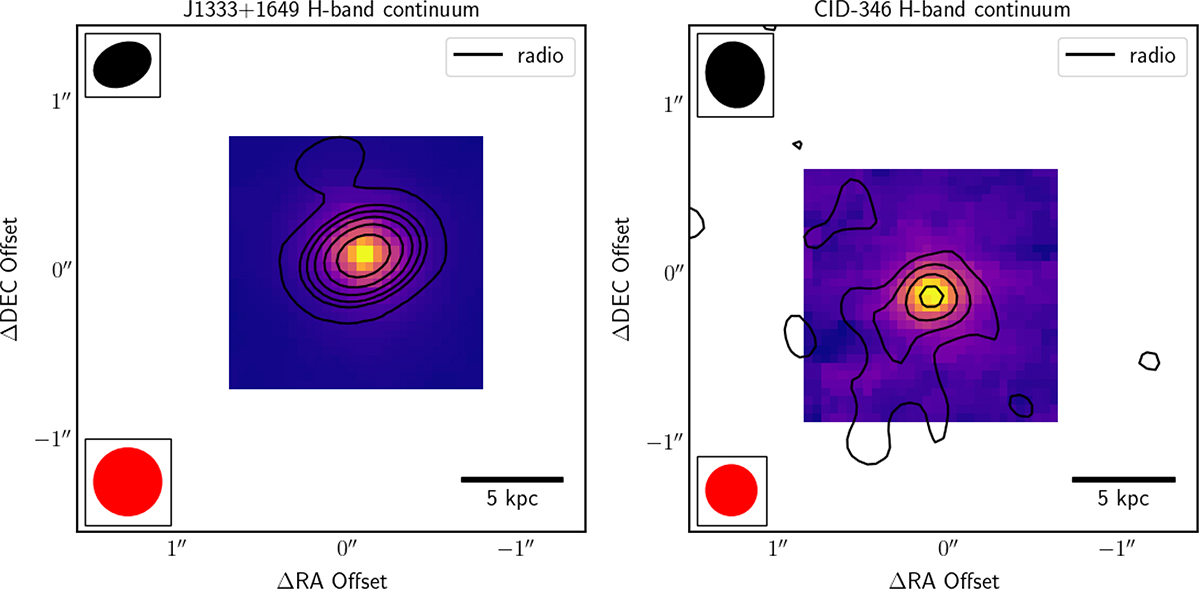
SINFONI H-band continuum maps for J1333+1649 (left panel) and CID-346 (right panel). The contours plotted at [36, 512, 1024, 2048, 4096, 8192]σ and [2, 4, 6, 8]σ show the VLA-A array radio data for J1333+1649 and CID-346, respectively. The PSF and beam for the ionized gas maps and radio image are represented by a red and a black ellipse, respectively. For XID-36, the H-band continuum is not detected.
Current usage metrics show cumulative count of Article Views (full-text article views including HTML views, PDF and ePub downloads, according to the available data) and Abstracts Views on Vision4Press platform.
Data correspond to usage on the plateform after 2015. The current usage metrics is available 48-96 hours after online publication and is updated daily on week days.
Initial download of the metrics may take a while.