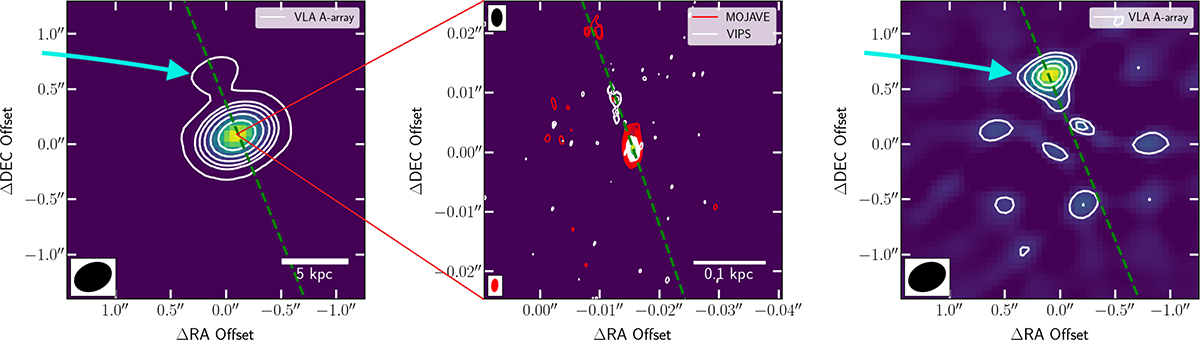
Fig. 2.
Download original image
Radio maps for J1333+1649. The beam is represented by a ellipse on each image. Left: VLA A-array 6.2 GHz radio map with contours plotted at levels of [36, 512, 1024, 2048, 4096, and 8192]σ. The dashed line indicates the position angle of the radio extended structure. Middle: MOJAVE 8.1 GHz radio map (background map) with MOJAVE 8.1 GHz and VIPS 5.0 GHz radio contours at [3, 4, 8, 16, 32, 64, 128, and 256]σ. The dashed line indicates the PA of the VIPS radio extended structure, which is similar to that of MOJAVE. Right: VLA A-array residual map from CASA after subtracting the central source with contours plotted at [16, 32, 64, and 96]σ. The cyan arrow indicates the extended radio structure.
Current usage metrics show cumulative count of Article Views (full-text article views including HTML views, PDF and ePub downloads, according to the available data) and Abstracts Views on Vision4Press platform.
Data correspond to usage on the plateform after 2015. The current usage metrics is available 48-96 hours after online publication and is updated daily on week days.
Initial download of the metrics may take a while.