Fig. 3.
Download original image
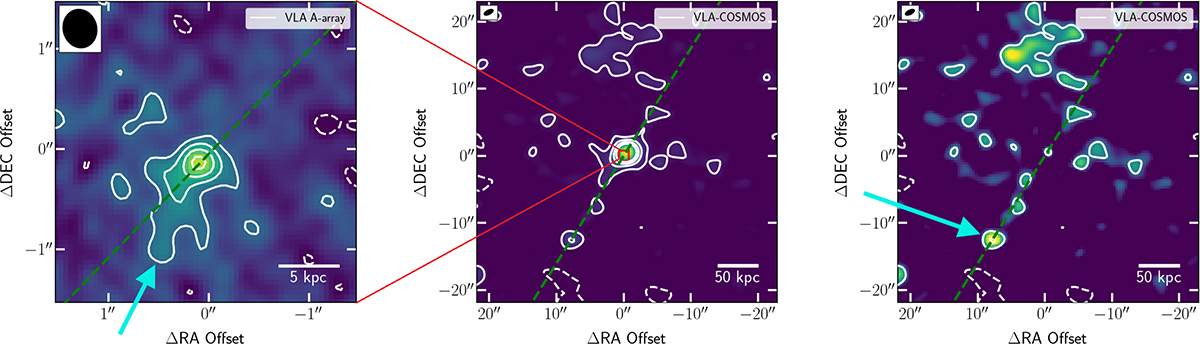
Radio map contours and residual map of images of CID-346. The beam is represented by a ellipse on each image. The dashed lines indicate the position angles of the extended structure. Left: VLA A-array with contours [−2, 2, 4, 6, and 8]σ. Middle: VLA-COSMOS radio map with contours plotted at [−2, 2, 4, 6, and 8]σ. Right: VLA-COSMOS residual map after removing central source with CASA with contours plotted at [−2, 2, and 4]σ. The VLA A-array observations were conducted at 6.2 GHz, while the VLA-COSMOS survey was performed at 1.4 GHz. The cyan arrows indicate the extended radio structure.
Current usage metrics show cumulative count of Article Views (full-text article views including HTML views, PDF and ePub downloads, according to the available data) and Abstracts Views on Vision4Press platform.
Data correspond to usage on the plateform after 2015. The current usage metrics is available 48-96 hours after online publication and is updated daily on week days.
Initial download of the metrics may take a while.