Open Access
Fig. 4.
Download original image
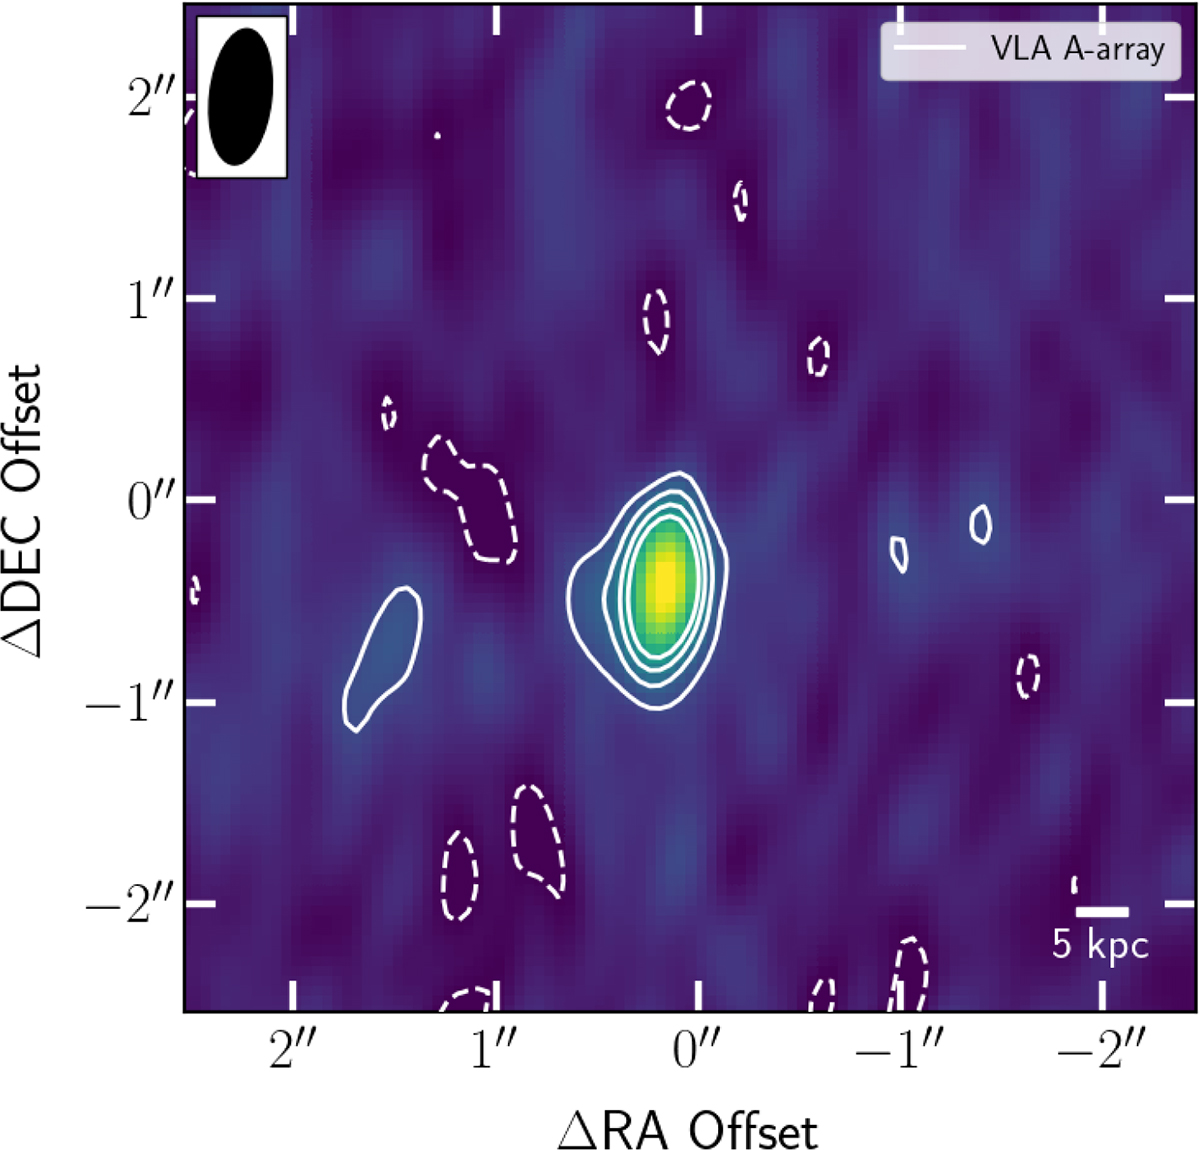
Radio map for XID-36. The contours at [−2, 2, 4, 6, and 8]σ show the VLA A-array radio data. The beam for the radio data is represented by an ellipse. The VLA A-array observations were conducted at 6.2 GHz. There is no strong evidence for extended radio structures in this source.
Current usage metrics show cumulative count of Article Views (full-text article views including HTML views, PDF and ePub downloads, according to the available data) and Abstracts Views on Vision4Press platform.
Data correspond to usage on the plateform after 2015. The current usage metrics is available 48-96 hours after online publication and is updated daily on week days.
Initial download of the metrics may take a while.