Fig. 5.
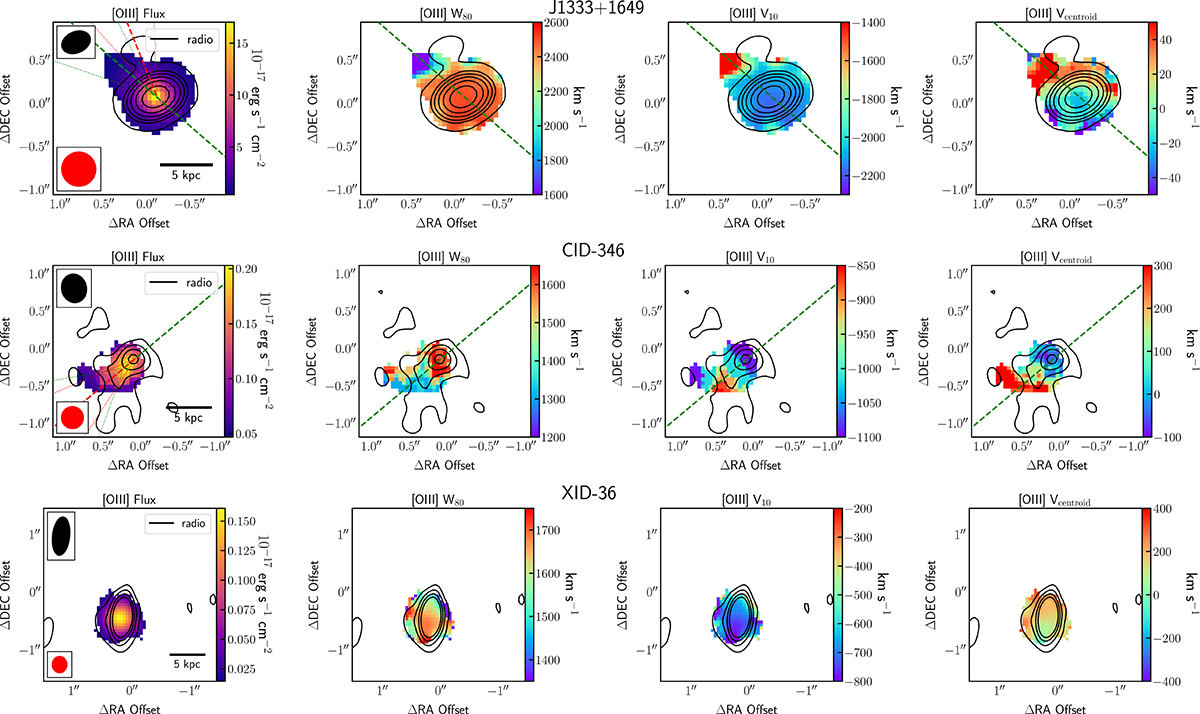
Download original image
[O III]λ5007 maps for our three targets. The PSF and beam for the ionized gas maps and radio image are represented by a red and a black ellipse, respectively. The green dashed line indicates the position angle of [O III]λ5007 emission, while the red dashed line indicates the radio PA. The dotted lines indicate the uncertainties of the PAs. Top: maps for J1333+1649. The contours plotted at [36, 512, 1024, 2048, 4096, and 8192]σ show the VLA-A array radio data. Middle: maps for CID-346. The contours at [2, 4, 6, and 8]σ show the VLA-A array radio data. Bottom: maps for XID-36. The contours at [2, 4, 6, and 8]σ show the VLA-A array radio data.
Current usage metrics show cumulative count of Article Views (full-text article views including HTML views, PDF and ePub downloads, according to the available data) and Abstracts Views on Vision4Press platform.
Data correspond to usage on the plateform after 2015. The current usage metrics is available 48-96 hours after online publication and is updated daily on week days.
Initial download of the metrics may take a while.