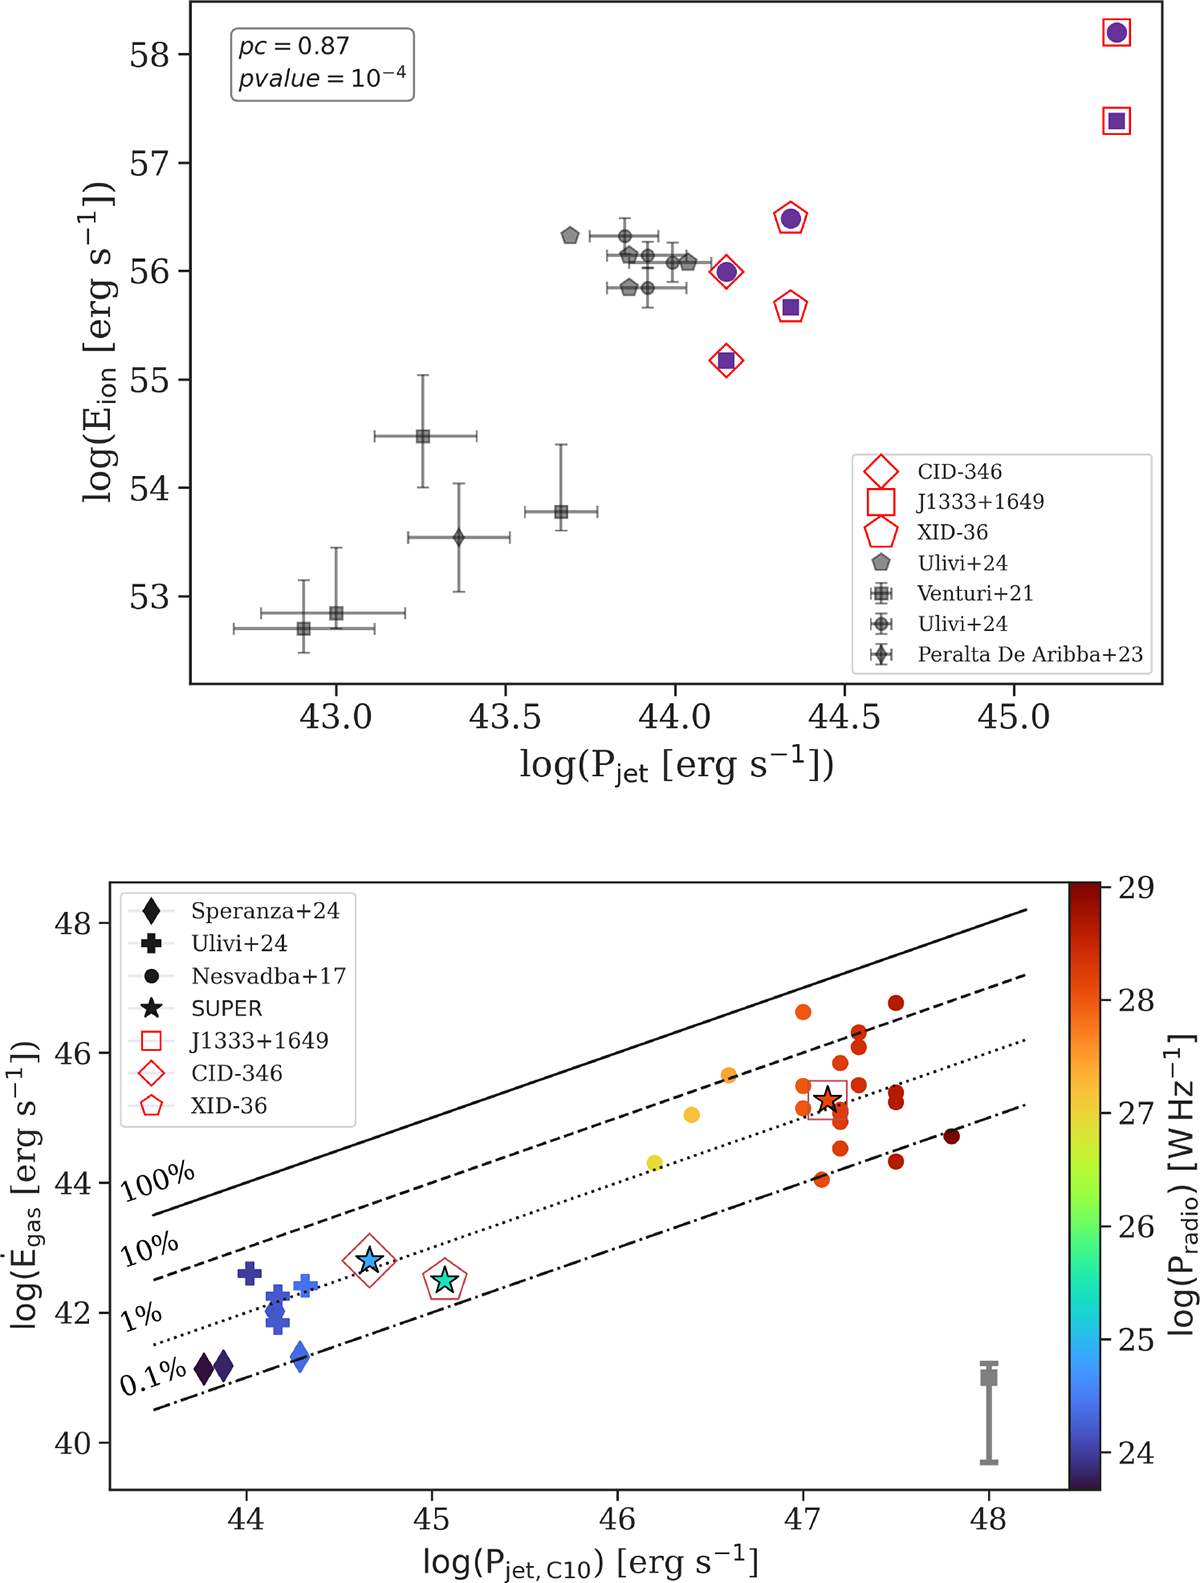
Fig. 7.
Download original image
Kinetic energy of the ionized gas versus radio jet power. Top: kinetic energy of the ionized gas in the disturbed region as a function of jet kinetic power (assuming the radio emission is attributed to jets) for our targets, Ulivi et al. (2024) sample and their data compilation (i.e., Venturi et al. 2021; Peralta de Arriba et al. 2023). The circles for our sample represent the kinetic energy values obtained considering W80 and the squares represent those obtained considering the velocity dispersion. Bottom: Kinetic energy injection rates as a function of inferred radio jet power (assuming the radio emission is attributed to jets) for our targets, Ulivi et al. (2024), Speranza et al. (2024) and Nesvadba et al. (2017). The values for our sample were calculated assuming a gas density of 500 cm−3, the same used by Nesvadba et al. (2017). The gray bar indicates the minimum and maximum variation in the outflow kinetic power values, considering electron densities of 104 cm−3 and 300 cm−3, respectively. The color bar shows the 1.4 GHz radio power. The diagonal lines indicate energy coupling efficiencies between the radio jet and the gas: 100%, 10%, 1%, and 0.1%.
Current usage metrics show cumulative count of Article Views (full-text article views including HTML views, PDF and ePub downloads, according to the available data) and Abstracts Views on Vision4Press platform.
Data correspond to usage on the plateform after 2015. The current usage metrics is available 48-96 hours after online publication and is updated daily on week days.
Initial download of the metrics may take a while.