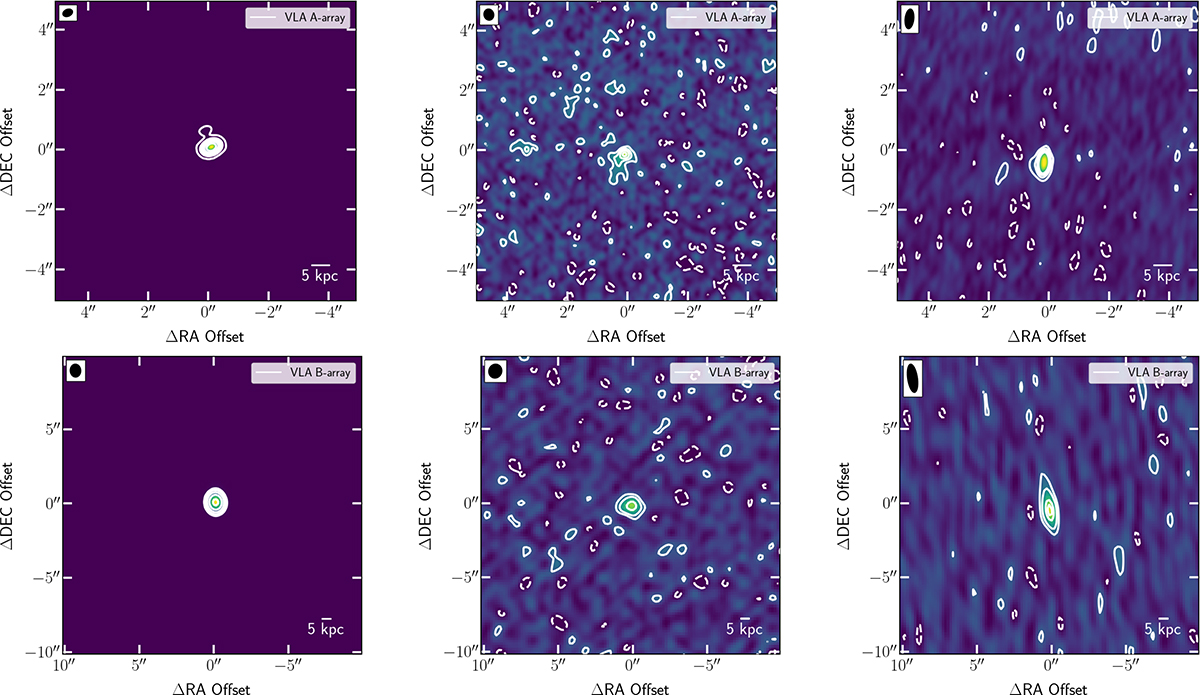
Fig. C.1.
Download original image
Radio contours maps of images for VLA A-array (top) and VLA B-array (bottom) with a larger field of view. The beam is represented by a ellipse at each image. Left: VLA A-array (top) and B-array (bottom) maps for J1333+164 with contours plotted at [36, 512, 1024, 2048, 4096, 8192]σ and [128, 256, 512,1024, 2048]σ, respectively. Middle: VLA A-array (top) and B-array (bottom) maps for CID-346 with contours plotted at [-2, 2, 4, 6, 8]σ and [-2, 2, 4, 8]σ, respectively. Right: VLA A-array (top) and B-array (bottom) maps for XID-36 with contours plotted at [-2, 2, 4, 6, 8]σ and [-2, 2, 4, 8, 10]σ, respectively.
Current usage metrics show cumulative count of Article Views (full-text article views including HTML views, PDF and ePub downloads, according to the available data) and Abstracts Views on Vision4Press platform.
Data correspond to usage on the plateform after 2015. The current usage metrics is available 48-96 hours after online publication and is updated daily on week days.
Initial download of the metrics may take a while.