Fig. 1.
Download original image
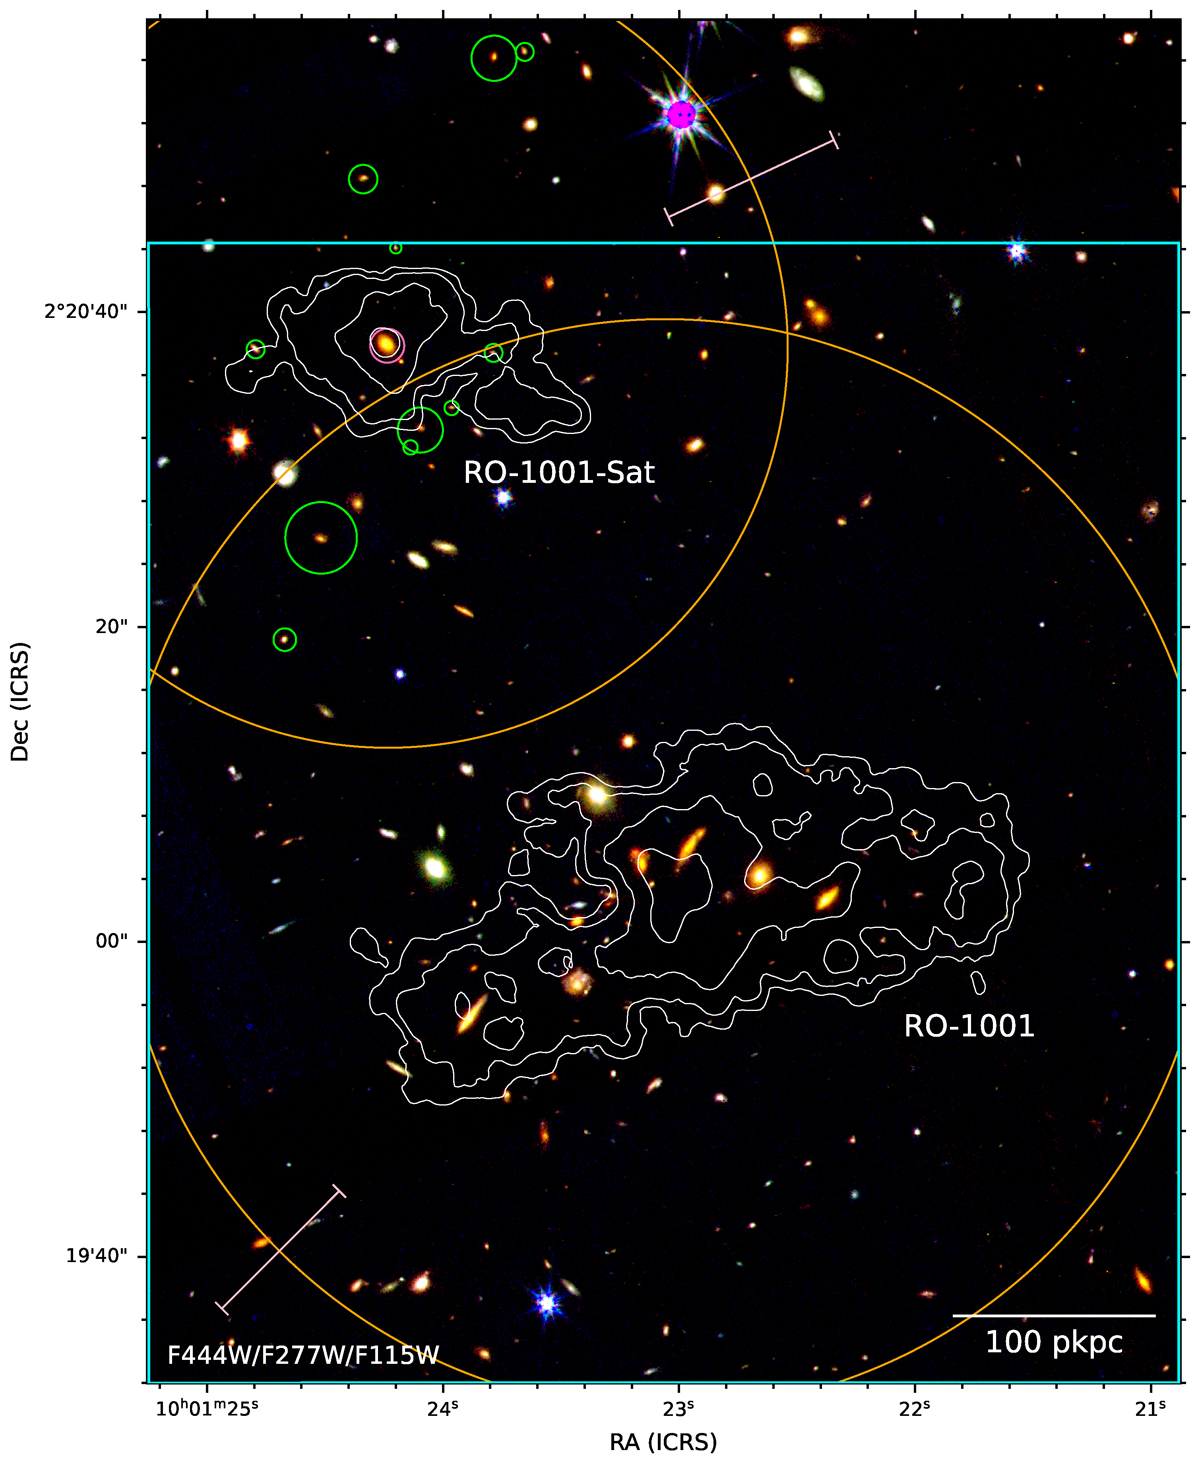
Colour image of RO-1001 and RO-1001-Sat from F444W, F277W and F115W bands of JWST NIRCam. The cyan box shows the 1.1′×1.2′ FOV of the MUSE mosaic. The orange circles show the virial radii of the two halos with the errors illustrated by the pink segment on each circle, being 197 ± 45 and 269 ± 41 kpc for RO-1001-Sat and RO-1001. The contours show the Lyα SB distributions in both nebulae displayed in steps of log![]() = (−18.5, −18.0, −17.5, −17.0). The lowest contour level corresponds to S/N = 5. Candidate member galaxies of the satellite halo in Table 2a are marked by green circles. The central brightest galaxy (log(M*/M⊙)≃11.3) is highlighted by the pink circle. The radii of the green circles are proportional to the stellar masses of the galaxies, ranging from log(M*/M⊙)≃9.5 − 10.3.
= (−18.5, −18.0, −17.5, −17.0). The lowest contour level corresponds to S/N = 5. Candidate member galaxies of the satellite halo in Table 2a are marked by green circles. The central brightest galaxy (log(M*/M⊙)≃11.3) is highlighted by the pink circle. The radii of the green circles are proportional to the stellar masses of the galaxies, ranging from log(M*/M⊙)≃9.5 − 10.3.
Current usage metrics show cumulative count of Article Views (full-text article views including HTML views, PDF and ePub downloads, according to the available data) and Abstracts Views on Vision4Press platform.
Data correspond to usage on the plateform after 2015. The current usage metrics is available 48-96 hours after online publication and is updated daily on week days.
Initial download of the metrics may take a while.