Fig. 11.
Download original image
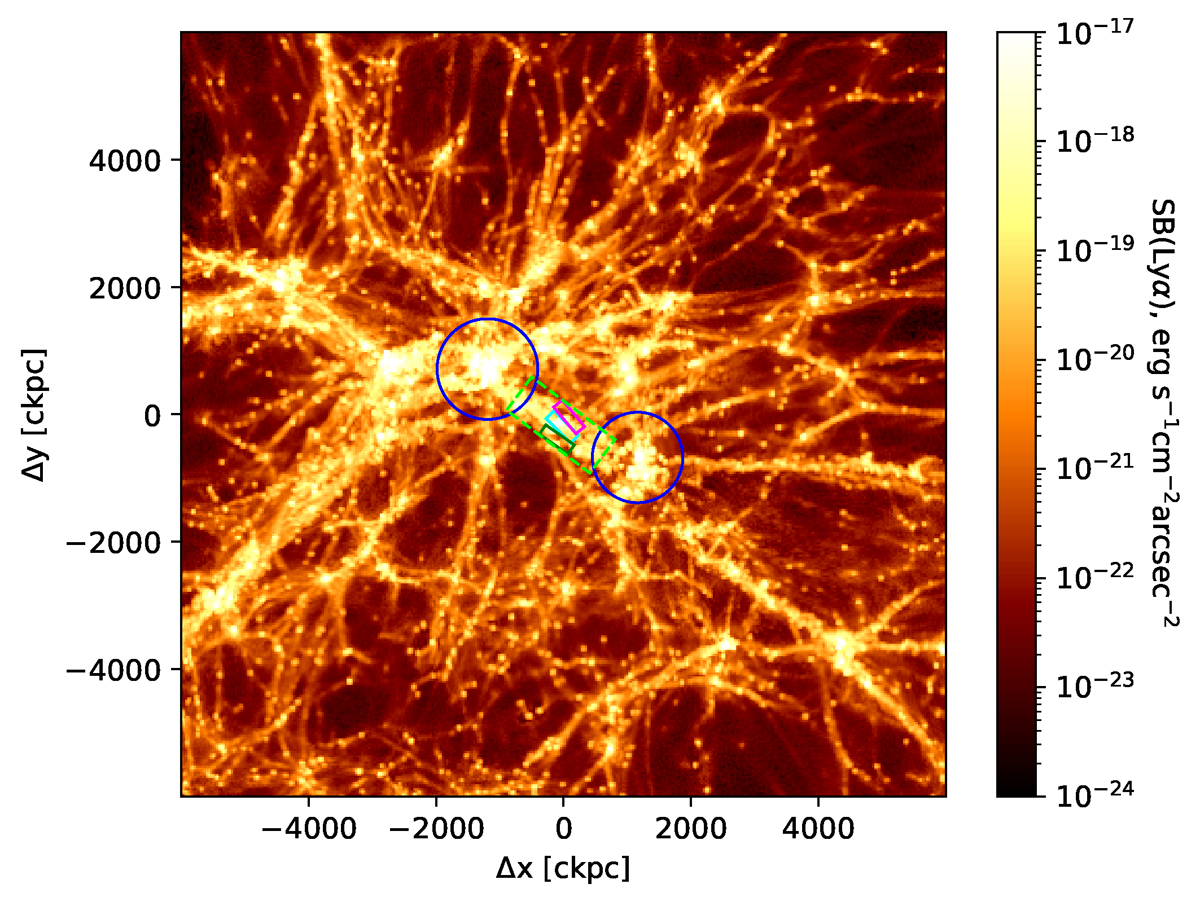
Lyα SB map showing a counterpart pair of halos in the TNG300 simulation projected on the xy plane. The Lyα SB is predicted by the model in Liu et al. (2025). The blue circles show the virial radii of the two halos. The three regions marked by solid rectangles are positioned mimicking regions taken between the two pairs of main and satellite LANs as shown in Fig. 10. The larger region marked by the dashed green rectangle encompasses the whole Lyα filament between the two halos.
Current usage metrics show cumulative count of Article Views (full-text article views including HTML views, PDF and ePub downloads, according to the available data) and Abstracts Views on Vision4Press platform.
Data correspond to usage on the plateform after 2015. The current usage metrics is available 48-96 hours after online publication and is updated daily on week days.
Initial download of the metrics may take a while.