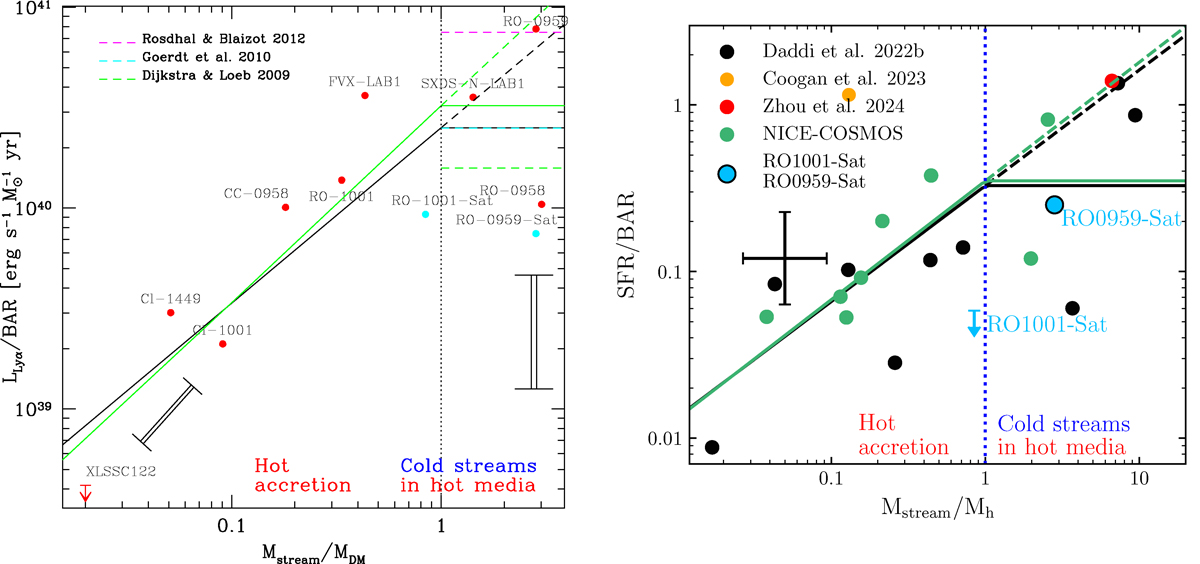
Fig. 12.
Download original image
Left: Revised Fig. 2 from Daddi et al. (2022b) showing the distribution of LANs in this work (blue points) and previous KCWI observations (red points) across the plane of LLyα/BAR-Mstream/Mh. The green line is the best fit in Daddi et al. (2022b) revised using the modified Mstream in Daddi et al. (2022a). Right: Revised Fig. 3 from Sillassen et al. (2024) showing how massive galaxy groups in this work (blue points), Coogan et al. (2023) (orange points), previous KCWI observations (Daddi et al. 2022b, black points), and the NICE survey (Zhou et al. 2024 in red points and Sillassen et al. 2024 in green points) are distributed across the SFRIR/BAR-Mstream/Mh plane. The green line is the original best fit in Sillassen et al. (2024). In both panels, black lines show the revised best fits of Eq. (4) in Daddi et al. (2022b) with αLyα = 0.87 ± 0.19 (left) and of Eq. (5) in Sillassen et al. (2024) with αSFR = 0.70 ± 0.15 (right) after adding RO-1001-Sat and RO-0959-Sat into the fits.
Current usage metrics show cumulative count of Article Views (full-text article views including HTML views, PDF and ePub downloads, according to the available data) and Abstracts Views on Vision4Press platform.
Data correspond to usage on the plateform after 2015. The current usage metrics is available 48-96 hours after online publication and is updated daily on week days.
Initial download of the metrics may take a while.