Open Access
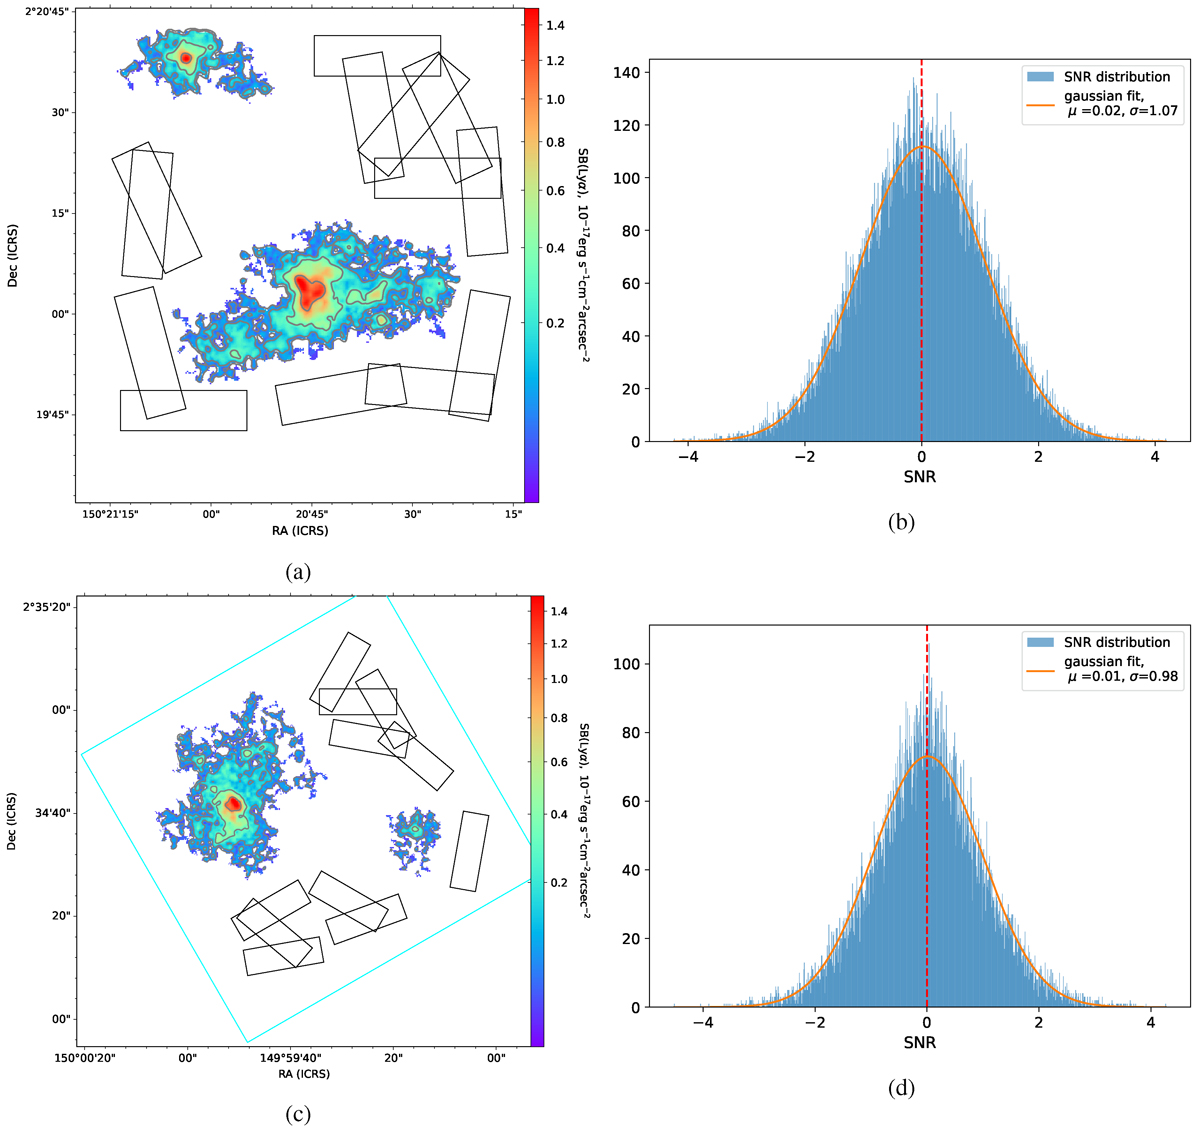
Fig. C.1.
Download original image
Lyα SB maps of (a) RO-1001 and (c) RO-0959 with black boxes showing apertures selected for the sky level check. The cyan box in (c) shows the MUSE FOV. (b)&(d) the S/N distributions of pixels in the apertures in the left panels fit with a Gaussian distribution.
Current usage metrics show cumulative count of Article Views (full-text article views including HTML views, PDF and ePub downloads, according to the available data) and Abstracts Views on Vision4Press platform.
Data correspond to usage on the plateform after 2015. The current usage metrics is available 48-96 hours after online publication and is updated daily on week days.
Initial download of the metrics may take a while.