Open Access
Fig. 3.
Download original image
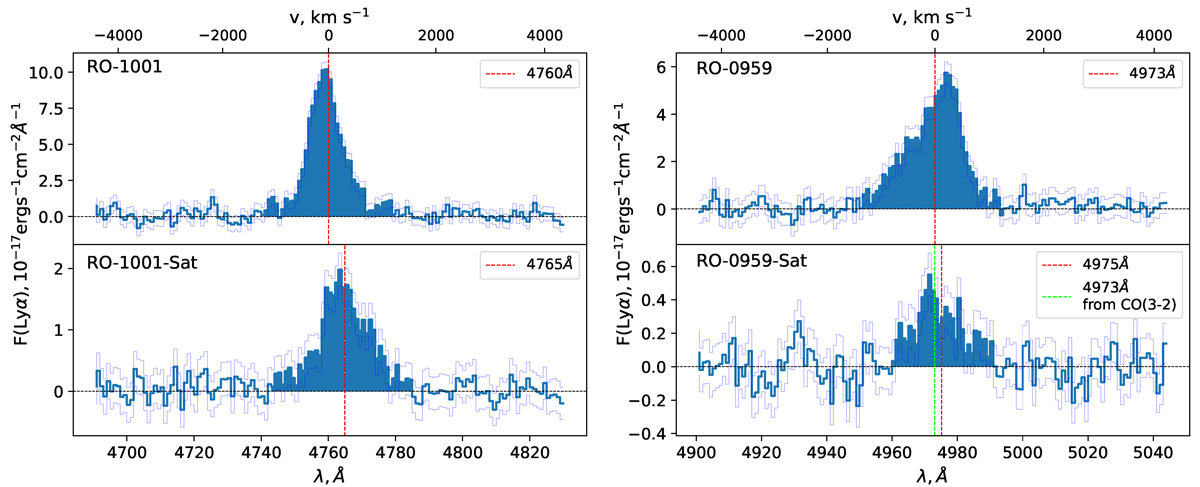
Lyα spectra integrated from the main and satellite nebulae of RO-1001 (left) and RO-0959 (right) after noise re-normalisation. Dashed red lines mark the flux-weighted peak of each spectrum. The dashed green line in the lower right panel shows the expected position of the Lyα peak from the CO(3-2) emission in RO-0959-Sat.
Current usage metrics show cumulative count of Article Views (full-text article views including HTML views, PDF and ePub downloads, according to the available data) and Abstracts Views on Vision4Press platform.
Data correspond to usage on the plateform after 2015. The current usage metrics is available 48-96 hours after online publication and is updated daily on week days.
Initial download of the metrics may take a while.