Fig. 4.
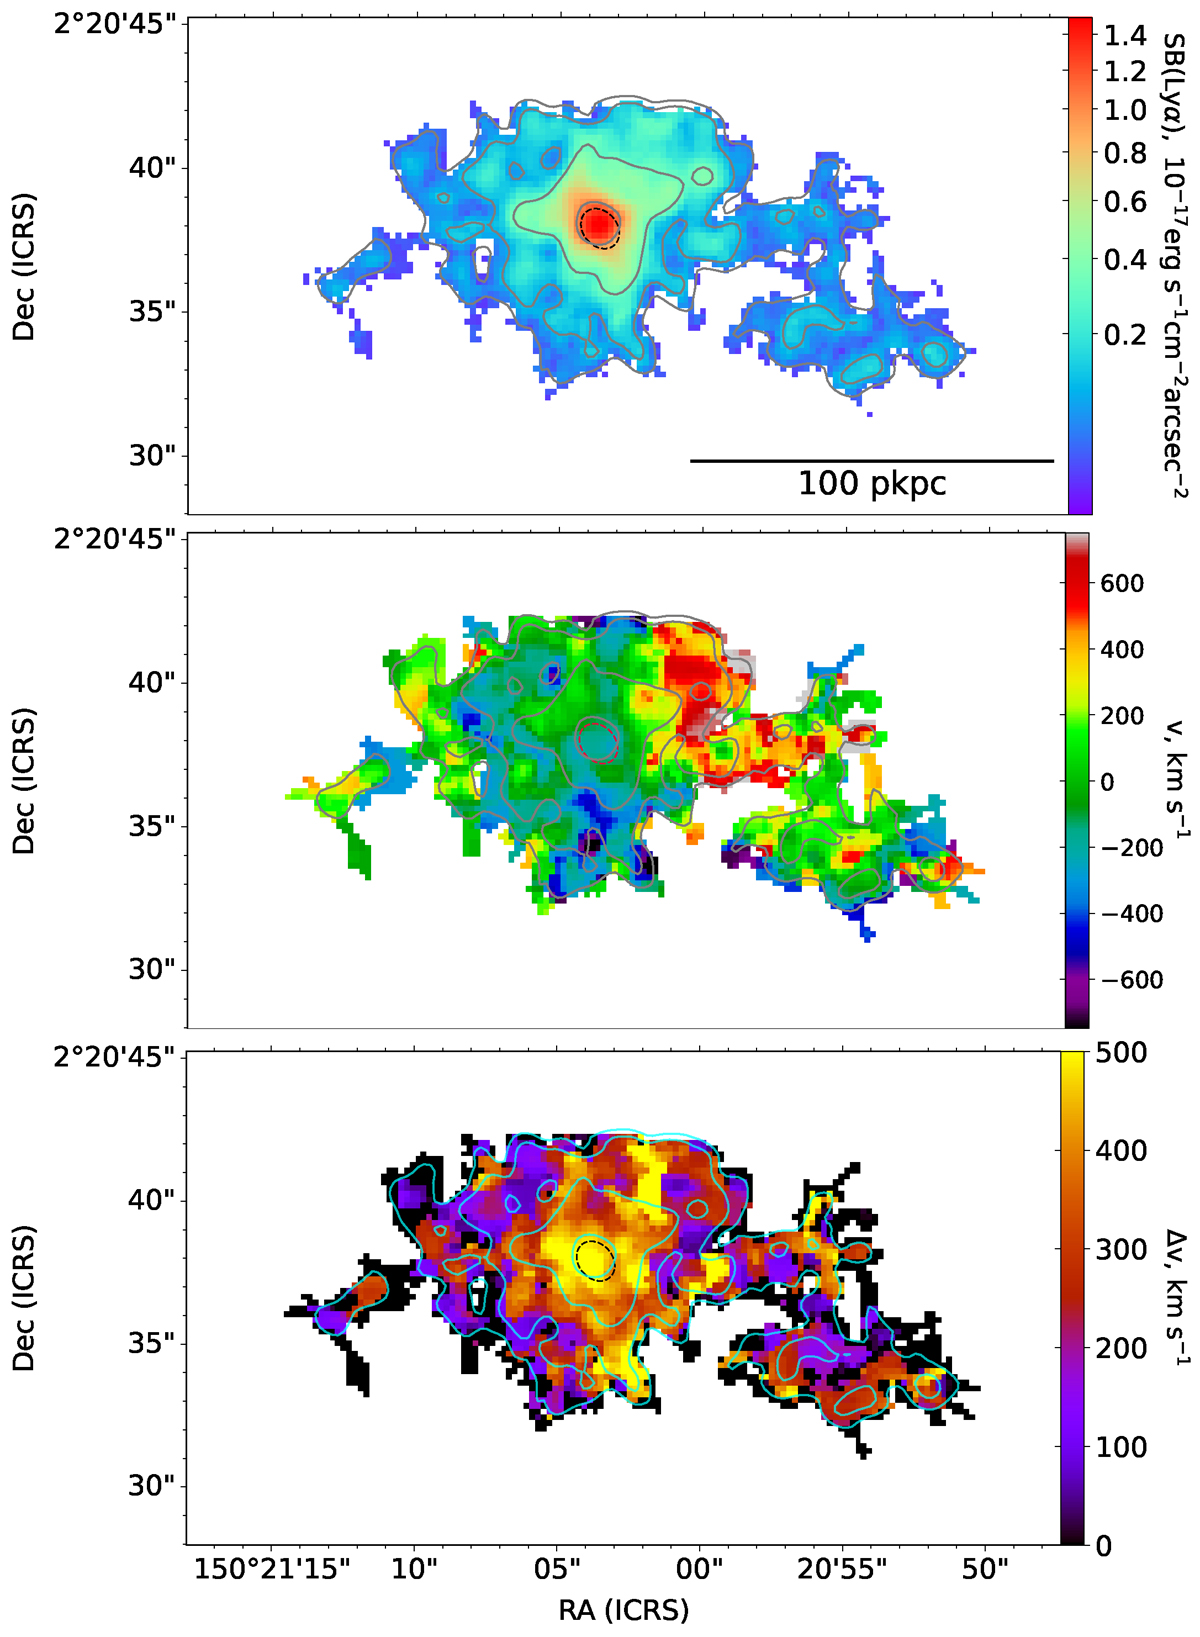
Download original image
Lyα SB (top), velocity (middle) and velocity dispersion (bottom) maps of RO-1001-Sat. The velocity map is referenced to the flux-weighted Lyα peak as the zero point. The contours in each map show the Lyα SB of the same levels as in Figure 1. The dashed ellipse at the centre of each map shows the location and approximate shape of the BGG as seen in Figure 1.
Current usage metrics show cumulative count of Article Views (full-text article views including HTML views, PDF and ePub downloads, according to the available data) and Abstracts Views on Vision4Press platform.
Data correspond to usage on the plateform after 2015. The current usage metrics is available 48-96 hours after online publication and is updated daily on week days.
Initial download of the metrics may take a while.