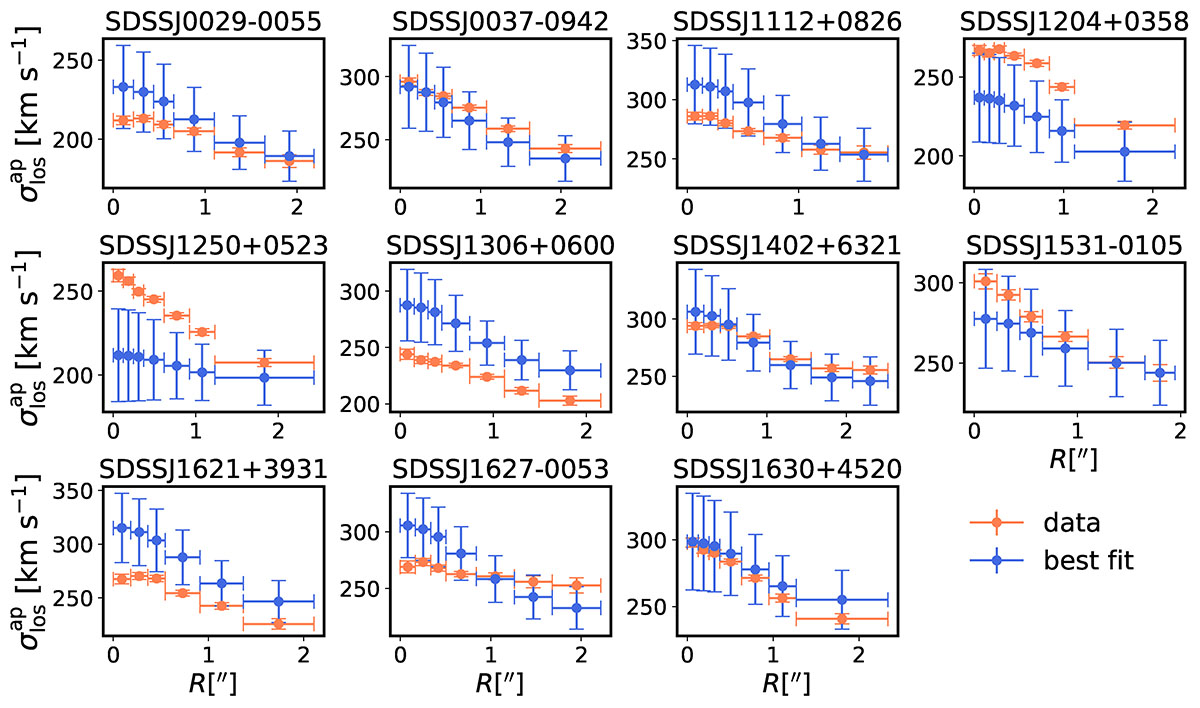
Fig. C.1.
Download original image
For each SLACS lens used in our analysis, we show the observed stellar velocity dispersion profile and the best fit found in the hierarchical analysis. The data for individual lenses is described very well by our model when applied to a single lens. However, in the hierarchical analysis, they were all required to share a single population-level value of λint (Section 7) with the time delay lenses and among each other. The offsets between the data and the best-fit model are due to mismatches between the population-level value of λint and the individual λint that would be required to fit each lens separately. The offsets are reflected in the non-zero scatter in λint found for the SLACS population.
Current usage metrics show cumulative count of Article Views (full-text article views including HTML views, PDF and ePub downloads, according to the available data) and Abstracts Views on Vision4Press platform.
Data correspond to usage on the plateform after 2015. The current usage metrics is available 48-96 hours after online publication and is updated daily on week days.
Initial download of the metrics may take a while.