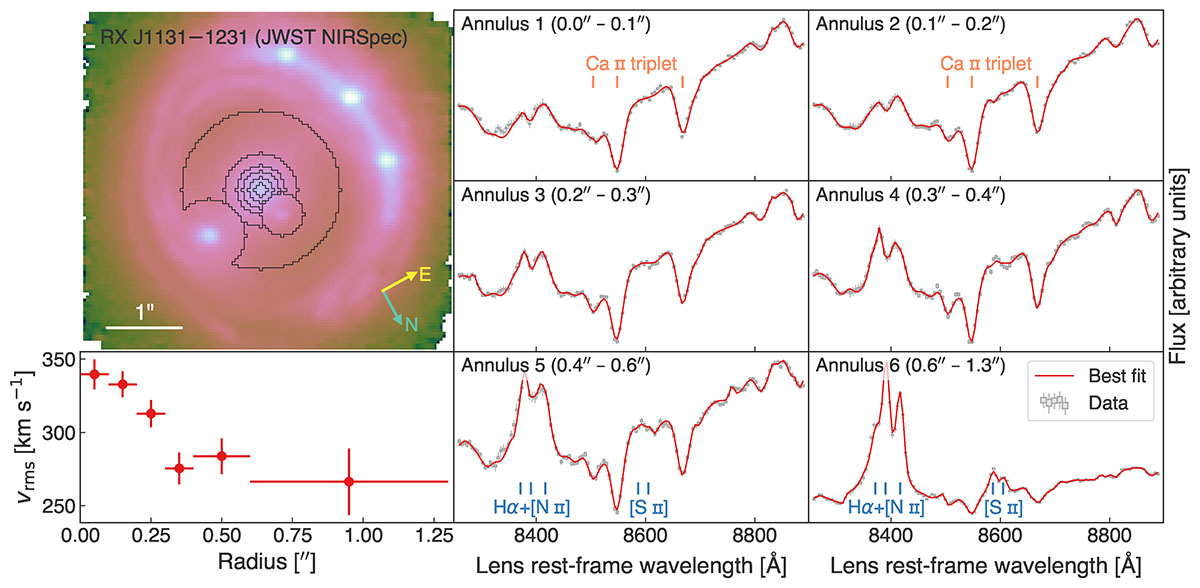
Fig. 2.
Download original image
JWST-NIRSpec spectra and kinematic fits for RX J1131−1231. Top left: The six annuli (black contours), from which summed spectra are extracted, are illustrated on top of the NIRSpec white-light image. The regions around the satellite galaxy and the closest quasar image are excluded. The white bar represents 1″ scale, and the North and East directions are pointed with emerald and yellow arrows, respectively. Bottom left: The measured vrms in the six annuli. The horizontal error bars show the annulus widths, and the vertical error bars show the combined statistical and systematic uncertainty for each measurement. The measured values have 0.66% covariance on average. Second and third columns: The six panels show the integrated spectra in each annulus (gray boxes) and the kinematic fit (red line). The height of the gray box represents the nominal uncertainty levels estimated by the JWST pipeline, and the size of the vertical error bars represents the total boosted uncertainty levels to achieve χred2 = 1 for each fit. The vertical orange lines mark the wavelengths of the Calcium triplet lines from the lens galaxy, and the vertical blue lines mark the wavelengths of the Hα, [N II], and [S II] lines from the quasar host galaxy.
Current usage metrics show cumulative count of Article Views (full-text article views including HTML views, PDF and ePub downloads, according to the available data) and Abstracts Views on Vision4Press platform.
Data correspond to usage on the plateform after 2015. The current usage metrics is available 48-96 hours after online publication and is updated daily on week days.
Initial download of the metrics may take a while.